This post was updated on December 7, 2022 to reflect that the Polaris Viz library has been released.
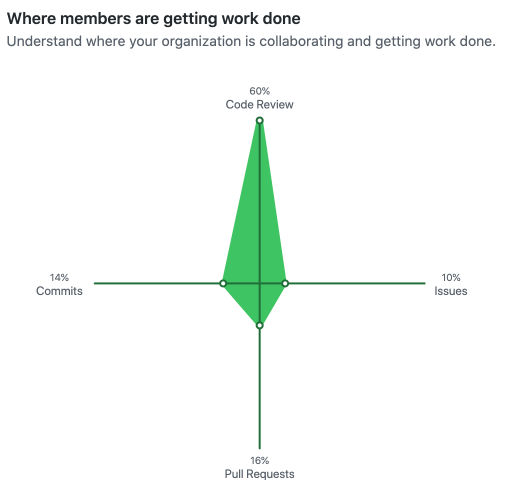
At Shopify, we tell a lot of stories through data visualization. This is the driving force behind business decisions—not only for our merchants, but also for teams within Shopify.
With more than 10,000 Shopify employees, though, it is only natural that different teams started using different tools to display data, which is great—after all, creative minds create diverse solutions, right? The problem is that it led to a lot of inconsistencies, like these two line charts that used to live in the Shopify admin—the page you see after logging in to Shopify, where you can set up your store, configure your settings, and manage your business—for example:
Let’s play Spot the Difference: line widths, dashed line styles, legend styles, background grids, one has labels on the X Axis, the other doesn’t... This isn’t just a “visual styles” problem since they use different libraries, one was accessible to screen readers and the other wasn’t; one was printable the other not.
To solve this problem, the Insights team has been working on creating a React data visualization library—Polaris Viz—that other teams can rely on to quickly implement data visualization without having to solve the same problems over and over again.
But first things first, if you haven’t yet, I recommend you start by reading my co-worker Miru Alves’ amazing blog post where she describes how we used Delta-E and Contrast Ratio calculations to create a color matrix with a collection of colors we can choose from to safely use without violating any accessibility rules.
This post is going to focus on the process of implementing the light and dark themes in the library, as well as allowing library consumers to create their own themes, since not all Shopify brands like Shop, Handshake, or Oberlo use the same visual identity.
Where Did the Inconsistencies Come From?
When we started tackling this issue, the first thing we noticed was that even in places that were already using only Polaris Viz, we had visual inconsistencies. This is because our original components API looked like this:
As you can see, changing the appearance of a chart involved many different options spread in different props, and you either had to create a wrapping component that has all the correct values or pass the props over and over again to each instance. OK, this explains a lot.
Ideally, all charts in the admin should use either the default dark or light themes that the UX team created, so we should make it easy for developers to choose light or dark without all this copyin’ && pasta.
Implementing Themes
To cover the use cases of teams that used the default dark or light themes, we removed all the visual style props and introduced a new theme prop to all chart components:
The theme prop accepts the name of a theme defined in a record of Themes.
The Theme type contains all visual configurations like colors, line styles, spacing, and if bars should be rounded or not.
These changes allow consumers to have all the good styles by default—styles that match our visual identity, take accessibility into consideration, and have no accidental discrepancies—and they just have to pass in theme=’Light’ if they want to use the Light instead of the Dark theme
This change should cover the majority of use cases, but we still need to support other visual identities. Putting back all those style props would lead to the same problems for whoever wasn’t using the default styles. So how could we make it easy to specify a different visual identity?
Introducing the PolarisVizProvider
We needed a way to allow consumers to define what their own visual identity looks like in a centralized manner so all charts across their applications would just use the correct styles. So instead of having the chart components consume the themes record from a const directly, we introduced a context provider that stores the themes:
By having the provider accept a themes prop, we allow consumers to overwrite the Default and Light themes or add their own. This implementation could cause some problems though: what happens if a user overwrites the Default theme, but doesn’t provide all the properties that are necessary to render a chart. For example what if they forget to pass the tooltip background color?
To solve this, we first implemented a createTheme function:
createTheme allows you to pass in a partial theme and obtain a complete theme. All the properties that are missing in the partial theme will just use the library’s default values.
Next, we implemented a createThemes function. It guarantees that even if properties are overwritten, the theme record will always contain the Default and Light themes:
With both of these in place, we just needed to update the PolarisVizProvider implementation:
Overwriting the Default Theme
From a consumer perspective, this means that you could wrap your application with a PolarisVizProvider, define your Default theme, and all charts will automagically inherit the correct styles. For example:
All charts inside of <App/> will have a blue background by default:
It hurts my eyes, but IT WORKS!
Creating Multiple Themes
You can also define multiple extra themes in the PolarisVizProvider. Each top level key in this object is used as a theme name that you can pass to individual charts later on. For example:
The first chart uses a theme named AngryRed and the second HappyGreen
We did have to repeat the definition of the single series color twice though—seriesColors.single = [‘black’]—it would be even more annoying if we had multiple properties shared by both themes and only wanted to overwrite some. We can make this easier by changing the implementation of the createTheme function to accept an optional baseTheme, instead of always using the default from the library:
With those changes in place, as a consumer I can just import createTheme from the library and use AngryRed as the base theme when creating HappyGreen:
Making Colors Change According to the Data Set
Another important feature we had in the library and didn’t want to lose was to change the series colors according to the data.
In this example, we’re applying a green gradient to the first chart to highlight the highest values as having more ordered items—more sales—is a good thing! In the second chart though, we’re applying a red gradient to highlight the highest values, since having more people return what they ordered isn’t such a good thing.
It would be super cumbersome to create extra themes any time we wanted a specific data series to use a different color, so we changed our DataSeries type to accept an optional colour that can overwrite the series colour coming from the theme:
So for the example above, we could have something like:
Next Steps
Polaris Viz will be open source soon! If you want to get access to the beta version of the library, help us test, or suggest features that might be useful for you, reach out to us at polaris-viz-feedback@shopify.com.
Krystal is a Staff Developer on the Visualization Experiences team. When she’s not obsessing over colors, shapes and animation she’s usually hosting karaoke & billiards nights with friends or avoiding being attacked by her cat, Pluma.
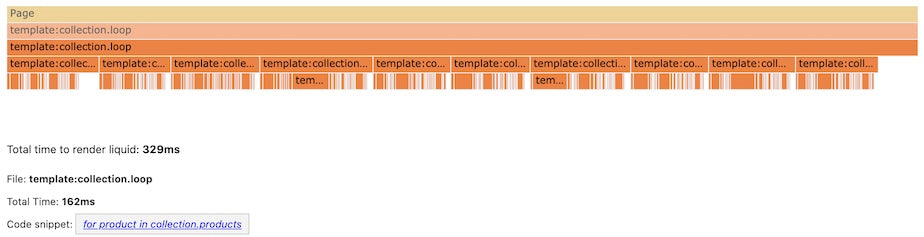
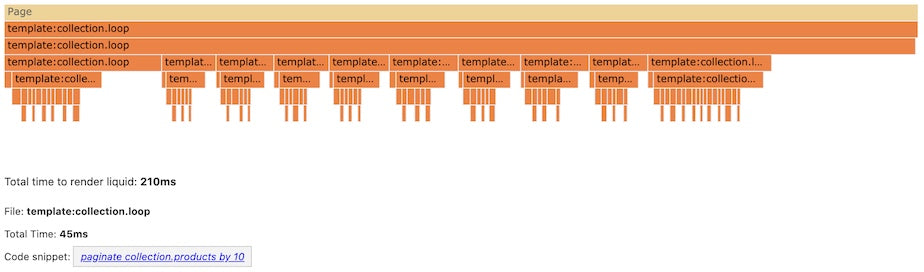
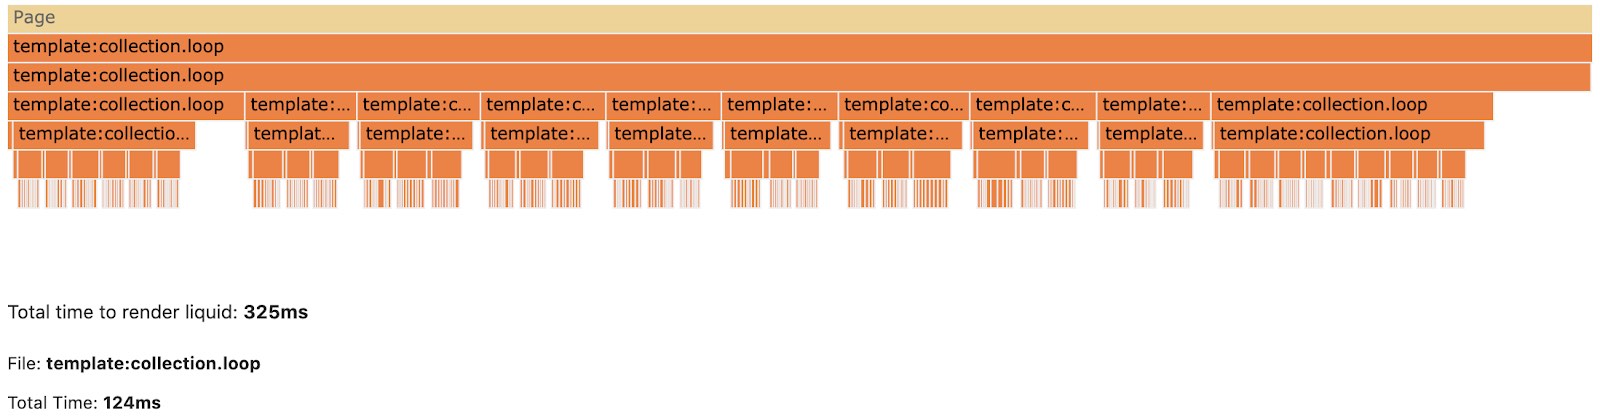
Not every feature of open-source template language Liquid has been ported over to Liquid-C, such as the If tag and For Tag. I started to look into how to compile Liquid’s If tag from Liquid-C, a process that would improve parsing time.
V8 is Google’s open source high-performance JavaScript and WebAssembly engine written in C++. v8go is a library written in Go and C++ allowing users to execute JavaScript from Go using V8 isolates. Using Cgo bindings allows us to run JavaScript in Go at native performance.
The v8go library, developed by Roger Chapman, aims to provide an idiomatic way for Go developers to interface with V8. As it turns out, this can be tricky. For the past few months, I’ve been contributing to v8go to expose functionality in V8. In particular, I’ve been adding support to expose the V8 CPU Profiler.
From the start, I wanted this new API to be:
easy for the library's Go users to reason about
easy to extend for other profiler functionality eventually
aligned closely with the V8 API
as performant as possible.
The point about performance is especially interesting. I theorized that my first iteration of the implementation was less performant than a proposed alternative. Without benchmarking them, I proceeded to rewrite. That second implementation was merged, and I moved on with my life. So when I was like "Hey! I should write a post about the PR and benchmark the results" only to actually see the benchmarks and reconsider everything.
If you’re interested in API development, Go/Cgo/C++ performance or the importance of good benchmarks, this is a story for you.
Backing Up to the Starting Line: What Was My Goal?
The goal of adding the V8 CPU Profiler to v8go was so users of the library could measure the performance of any JavaScript being executed in a given V8 context. Besides providing insight on the code being executed, the profiler returns information about the JavaScript engine itself including garbage collection cycles, compilation and recompilation, and code optimization. While virtual machines and the like can run web applications incredibly fast, code should still be performant, and it helps to have data to understand when it's not.
If we have access to a CPU profiler, we can ask it to start profiling before we start executing any code. The profiler samples the CPU stack frames at a preconfigured interval until it's told to stop. Sufficient sampling helps show the hot code paths whether that be in the source code or in the JavaScript engine. Once the profiler has stopped, a CPU profile is returned. The profile comes in the form of a top-down call tree composed of nodes. To walk the tree, you get the root node and then follow its children all the way down.
Here’s an example of some JavaScript code we can profile:
Using v8go, we start by creating the V8 isolate, context, and CPU profiler. Before running the above code, the profiler is told to start profiling:
After the code has finished running, the profiling is stopped and the CPU profile returned. A simplified profile in a top-down view for this code looks like:
Each of these lines corresponds to a node in the profile tree. Each node comes with plenty of details including:
name of the function (empty for anonymous functions)
id of the script where the function is located
name of the script where the function originates
number of the line where the function originates
number of the column where the function originates
whether the script where the function originates is flagged as being shared cross-origin
count of samples where the function was currently executing
For the purposes of v8go, we don’t need to have opinions about how the profile should be formatted, printed, or used since this can vary. Some may even turn the profile into a flame graph. It’s more important to focus on the developer experience of trying to generate a profile in a performant and idiomatic way.
Evolving the API Implementation
Given the focus on performance and an idiomatic-to-Go API, the PR went through a few different iterations. These iterations can be categorized into two distinct rounds: the first where the profile was lazily loaded and the second where the profile was eagerly loaded. Let’s start with lazy loading.
Round 1: Lazy Loading
The initial approach I took aligned v8go with V8's API as closely as possible. This meant introducing a Go struct for each V8 class we needed and their respective functions (that is, CPUProfiler, CPUProfile, and CPUProfileNode).
This is the Go code that causes the profiler to stop profiling and return a pointer to the CPU profile:
This is the corresponding C++ code that translates the request in Go to V8's C++:
With access to the profile in Go, we can now get the top-down root node:
The root node exercises this C++ code to access the profiler pointer and its corresponding GetTopDownRoot() method:
With the top-down root node, we can now traverse the tree. Each call to get a child, for instance, is its own Cgo call as shown here:
The Cgo call exercises this C++ code to access the profile node pointer and its corresponding GetChild() method:
The main differentiator of this approach is that to get any information about the profile and its nodes, we have to make a separate Cgo call. For a very large tree, this makes at least kN more Cgo calls where k is the number of properties queried, and N is the number of nodes. The value for k will only increase as we expose more properties on each node.
How Go and C Talk to Each Other
At this point, I should explain more clearly how v8go works. v8go uses Cgo to bridge the gap between Go and V8's C code. Cgo allows Go programs to interoperate with C libraries: calls can be made from Go to C and vice versa.
Upon some research about Cgo's performance, you'll find Sean Allen’s Gophercon 2018 talk where he made the following recommendation:
“Batch your CGO calls. You should know this going into it, since it can fundamentally affect your design. Additionally once you cross the boundary, try to do as much on the other side as you can. So for go => “C” do as much as you can in a single “C” call. Similarly for “C” => go do as much as you can in a single go call. Even more so since the overhead is much higher.”
Similarly, you’ll find Dave Cheney’s excellent “cgo is not go” that explains the implications of using cgo:
“C doesn’t know anything about Go’s calling convention or growable stacks, so a call down to C code must record all the details of the goroutine stack, switch to the C stack, and run C code which has no knowledge of how it was invoked, or the larger Go runtime in charge of the program. … The take-away is that the transition between the C and Go world is non trivial, and it will never be free from overhead.”
When we talk about “overhead,” the actual cost can vary by machine but some benchmarks another contributor v8go (Dylan Thacker-Smith) ran show an overhead of about 54 nanoseconds per operation (ns/op) for Go to C calls and 149 ns/op for C to Go calls:
Given this information, the concern for the lazy loading is justified: when a user needs to traverse the tree, they’ll make many more Cgo calls, incurring the overhead cost each time. After reviewing the PR, Dylan made the suggestion of: building the entire profile graph in C code and then passing a single pointer back to Go so Go could rebuild the same graph using Go data structures loaded with all the information that can then be passed to the user. This dramatically reduces the number of Cgo calls. This brings us to round #2.
Round 2: Eager Loading
To build out a profile for visualization, users will need access to most if not all of the nodes of the profile. We also know that for performance, I want to limit the number of C calls that have to be made in order to do so. So, we move the heavy-lifting of getting the entire call graph inside of our C++ function StopProfiling so that the pointer we return to the Go code is to the call graph fully loaded with all the nodes and their properties. Our go CPUProfile and CPUProfileNode objects will match V8’s API in that they have the same getters, but now, internally, they just return the values from the structs private fields instead of reaching back to the C++ code.
This is what the StopProfiling function in C++ does now: once the profiler returns the profile, the function can traverse the graph starting at the root node and build out the C data structures so that a single pointer to the profile can be returned to the Go code that can traverse the graph to build corresponding Go data structures.
The corresponding function in Go, StopProfiling, uses Cgo to call the above C function (CPUProfilerStopProfiling) to get the pointer to our C struct CPUProfile. By traversing the tree, we can build the Go data structures so the CPU profile is completely accessible from the Go side:
With this eager loading, the rest of the Go calls to get profile and node data is as simple as returning the values from the private fields on the struct.
Round 3 (Maybe?): Lazy or Eager Loading
There’s the potential for a variation where both of the above implementations are options. This means allowing users to decide where they want to lazily or eagerly load everything on the profile. It’s another reason why, in the final implementation of the PR, the getters were kept instead of just making all of the Node and Profile fields public. With the getters and private fields, we can change what’s happening under the hood based on how the user wants the profile to load.
Speed is Everything, So Which One's Faster?
Comparing lazy and eager loading required a test that executed some JavaScript program with a decently sized tree so we could exercise a number of Cgo calls on many nodes. We would measure if there was a performance gain by building the tree eagerly in C and returning that complete call graph as a pointer back to Go.
For quite a while, I ran benchmarks using the JavaScript code from earlier. From those tests, I found that:
When lazy loading the tree, the average duration to build it is ~20 microseconds.
When eagerly loading the tree, the average duration to build it is ~25 microseconds.
It's safe to say these results were unexpected. As it turns out, the theorized behavior of the eager approach wasn’t more optimal than lazy loading, in fact, it was the opposite. It relied on more Cgo calls for this tree size.
However, because these results were unexpected, I decided to try a much larger tree using the Hydrogen starter template. From testing this, I found that:
When lazy loading the tree, the average duration to build it is ~90 microseconds.
When eagerly loading the tree, the average duration to build it is ~60 microseconds.
These results aligned better with our understanding of the performance implications of making numerous Cgo calls. It seems that, for a tiny tree, the cost of traversing it three times (twice to eagerly load information and once to print it) doesn’t cost less than the single walk to print it that includes numerous Cgo calls. The true cost only shows itself on a much larger tree where the benefit of the upfront graph traversal cost greatly benefits the eventual walkthrough of a large tree to be printed. If I hadn’t tried a different sized input, I would never have seen that the value of eager loading eventually shows itself. If I drew the respective approaches of growth lines on a graph, it would look something like:
Looking Back at the Finish line
As a long time Go developer, there’s plenty of things I take for granted about memory management and performance. Working on the v8go library has forced me to learn about Cgo and C++ in such a way that I can understand where the performance bottlenecks might be, how to experiment around them, and how to find ways to optimize for them. Specifically contributing the functionality of CPU profiling to the library reminded me that:
I should benchmark code when performance is critical rather than just going with my (or another’s) gut. It absolutely takes time to flesh out a sufficient alternative code path to do fair benchmarking, but chances are there are discoveries made along the way.
Designing a benchmark matters. If the variables in the benchmark aren’t reflective of the average use case, then the benchmarks are unlikely to be useful and may even be confusing.
Thank you to Cat Cai, Oliver Fuerst, and Dylan Thacker-Smith for reviewing, clarifying, and generally just correcting me when I'm wrong.
About the Author:
Genevieve is a Staff Developer at Shopify, currently working on Oxygen.
If building systems from the ground up to solve real-world problems interests you, our Engineering blog has stories about other challenges we have encountered. Visit our Engineering career page to find out about our open positions. Join our remote team and work (almost) anywhere. Learn about how we’re hiring to design the future together—a future that is digital by default.
Shopify loves Ruby and opportunities to get together with other engineers who love Ruby to learn, share, and build relationships. In November, Rubyists from Shopify’s Ruby and Rails infrastructure teams gathered in Denver at RubyConf 2021 to immerse themselves in all things Ruby with a community of their peers. If you weren’t there or want to revisit the content, we’ve compiled a list of the talks from our engineers.
“Why is it worth looking at Ruby compilers? Why is it worth looking at compilers at all? Well, I think compilers are fascinating. I’ve been working on them for a couple of decades. I think one of the great things about compilers, you can talk to anyone who’s a developer about compilers, because we all use compilers. Everyone’s got an opinion on how the languages should be designed. You can have conversations with anyone at every level about compilers, and compilers are just really fun. They may seem like a deeply technical topic, but they’re conceptually fairly simple. They take a file as input, they do something internally, and they produce a file as output.”
In this talk, Chris dives into the history of Ruby compilers, the similarities and differences, and what we can learn from them.
In typical Aaron style, this talk is filled with puns and humor while being educational and thought-provoking. Aaron shares why he wrote a JIT compiler for Ruby. Why did he write a JIT compiler?
To see if he could.
“I wanted to see if I could build this thing. For me, programming is a really creative and fun endeavor. I love to program. And many times I’ll just write a project just to see if I can do it. And this is one of those cases. So, I think maybe people are asking, ‘does this thing actually work?’”
Watch Aaron’s talk to find out if it does work and learn how to build a JIT compiler in pure Ruby.
Building a New JIT Compiler Inside CRuby by Maxime Chevalier Boisvert
In this talk, Maxime talks about YJIT, an open-source project led by a small team of developers at Shopify to incrementally build a new JIT compiler inside CRuby. She discusses the key advantages of YJIT, the approach the team is taking to implement YJIT, and early performance results.
“The objective is to produce speedups on real-world software. For us, real-world software means large web workloads, such as Ruby on Rails. The benefits of our approach is we’re highly compatible with all existing Ruby code and we’re able to support all of the latest Ruby features.”
Gradual Typing in Ruby–A Three Year Retrospective by Ufuk Kayserilioglu and Alexandre Terrasa
Ufuk and Alexandre share a retrospective of adopting Sorbet at Shopify, why you don’t have to go full-in on types out of the gate, and why gradual typing might be a great middle-ground for your team. They also share lessons learned from a business and technical perspective.
“You shouldn’t be getting in the way of people doing work. If you want adoption to happen, you need to ramp up gently. We’re doing gradual type adoption. And because this is gradual-type adoption, it’s totally okay to start slow, to start at the lowest strictness levels, and to gradually turn it up as people are more comfortable and as you are more comfortable using the tools.”
Building Native Extensions. This Could Take A While... by Mike Dalessio
At RubyKaigi 2021, Mike did a deep dive into the techniques and toolchain used to build and ship native C extensions for Ruby. In his latest talk at RubyConf 2021, Mike expands upon the conversation to explore why Nokogiri evolved to use more complex techniques for compilation and installation over the years and touches upon human trust and security.
“Nokogiri is web-scale now. Since January (2021), precompiled versions of Nokogiri have been downloaded 60 million times. It’s a really big number. If you do back of the envelope power calculations, assuming some things about your core, 2.75 megawatts over 10 months have been saved.”
Mike has provided companion material to the talk on GitHub.
Parsing Ruby by Kevin Newton
Kevin digs into the topic of Ruby parsers with a thorough deep dive into the technical details and tradeoffs of different tools and implementations. While parsing is a technically challenging topic, Kevin delivers a talk that speaks to junior and senior developers, so there’s something for everyone!
“Parser generators are complicated technologies that use shift and reduce operations to build up syntax trees. Parser generators are difficult to maintain across implementations of languages. They’re not the most intuitive of technologies and it’s difficult to maintain upstream compatibility. It’s a good thing that Ruby is going to slow down on syntax and feature development because it’s going to give an opportunity for all the other Ruby implementations to catch up.”
Problem Solving Through Pair Programming by Emily Harber
We love pair programming at Shopify. In this talk, Emily explores why pair programming is a helpful tool for getting team members up to speed and writing high-quality code, allowing your team to move faster and build for the long term. Emily also provides actionable advice to get started to have more productive pairing sessions.
“Pair programming is something that should be utilized at all levels and not exclusively as a part of your onboarding or mentorship processes. Some of the biggest benefits of pairing carry through all stages of your career and through all phases of development work. Pairing is an extremely high fidelity way to build and share context with your colleagues and to keep your code under constant review and to combine the strengths of multiple developers on a single piece of a shared goal.”
Achieving Fast Method Metaprogramming: Lessons from MemoWise by Jemma Issroff
In this talk, Jemma and Jacob share the journey of developing MemoWise, Ruby’s most performant memoization gem. The presentation digs into benchmarking, unexpected object allocations, performance problems common to Ruby metaprogramming, and their experimentation to develop techniques to overcome these concerns.
“So we were really critically concerned with optimizing our performance as much as possible. And like any good scientist, we followed the scientific method to ensure this happens. So four steps: Observation, hypothesis, experiment, and analysis. Benchmarks are one of the best ways to measure performance and to an experiment that we can use over and over again to tell us exactly how performant our code is or isn’t.”
Programming with Something by Tom Stuart
In this talk, Tom explores how to store executable code as data in Ruby and write different kinds of programs that process it. He also tries to make “fasterer” and “fastererer” words, but we’ll allow it because he shares a lot of great content.
“A simple idea like the SECD machine is the starting point for a journey of iterative improvement that lets us eventually build a language that’s efficient, expressive, and fast.”
If you are interested in exploring the code shown in Tom’s talk, it’s available on GitHub.
The Audacious Array by Ariel Caplan
Do you love Arrays? In this talk, Ariel explores the “powerful secrets” of Ruby arrays by using…cats! Join Ariel on a journey through his game, CatWalk, which he uses to discuss the basics of arrays, adding and removing elements, creating randomness, interpretation, arrays as sets, and more.
“When we program, many of the problems that we solve fall into the same few categories. We often need to create constructs like a randomizer, a 2D representation of data like a map, some kind of search mechanism, or data structures like stacks and queues. We might need to take some data and use it to create some kind of report, And sometimes we even need to do operations that are similar to those we do on a mathematical set. It turns out, to do all of these things, and a whole lot more, all we need is a pair of square brackets. All we need is one of Ruby’s audacious arrays.”
If you want to explore the code for Ariel’s “nonsensical” game, CatWalk, check it out on GitHub.
Ruby Archaeology by Nick Schwaderer
In this talk, Nick “digs” into Ruby archeology to run old code and explore Ruby history and interesting gems from the past and shares insights into what works and what’s changed from these experiments.
“So why should you become a Ruby archeologist? There are hundreds of millions, if not billions, of lines of valid code, open source for free, on the internet that you can access today. In the Ruby community today, sometimes it feels like we’re converging.”
Keeping Developers Happy With a Fast CI by Christian Bruckmayer
As a member of Shopify’s test infrastructure team, Christian ensures that the continuous integration (CI) systems are scalable, robust, and usable. In this talk, Christian shares techniques such as monitoring, test selection, timeouts, and the 80/20 rule to speed up test suites.
“The reason we have a dedicated team is just the scale of Shopify. So the Rails core monolith has approximately 2.8 million lines of code, over a thousand engineers work on it, and in terms of testing we have 210,000 Ruby tests. If you execute them it would take around 40 hours. We run around 1,000 builds per day, which means we run around 100 million test runs per day. So that’s a lot.”
Note: The first 1:40 of Christian’s talk has minor audio issues, but don’t bail on the talk because the audio clears up quickly, and it’s worth it!
Parallel Testing With Ractors–Putting CPU's to Work by Vinicius Stock
Vini talks about using Ractors to parallelize test execution, builds a test framework built on Ractors, compares current solutions, and discusses the advantages and limitations.
“Fundamentally, tests are just pieces of code that we want to organize and execute. It doesn’t matter if in Minitest they are test methods and in RSpec they are Ruby blocks, they’re just blocks of code that we want to run in an organized manner. It then becomes a matter of how fast we can do it in order to reduce the feedback loop for our developers. Then we start getting into strategies for parallelizing the execution of tests.”
Optimizing Ruby's Memory Layout by Peter Zhu & Matt Valentine-House
Peter and Matt discuss how their variable width allocation project can move system heap memory into Ruby heap memory, reducing system heap allocations, and providing finer control of the memory layout to optimize for performance.
“We’re confident about the stability of variable width allocation. Variable width allocation passes all tests on CI on Shopify’s Rails monolith, and we ran it for a small portion of production traffic of a Shopify service for a week, where it served over 500 million requests.”
Bonus: Meet Shopify's Ruby and Rails Infrastructure Team (AMA)
There were a LOT of engineers from the Ruby and Rails teams at Shopify at RubyConf 2021. Attendees had the opportunity to sit with them at a meet and greet session to ask questions about projects, working at Shopify, “Why Ruby?”, and more.
Jennie Lundrigan is a Senior Engineering Writer at Shopify. When she's not writing nerd words, she's probably saying hi to your dog.
We want your feedback! Take our reader surveyand tell us what you're interested in reading about this year.
If building systems from the ground up to solve real-world problems interests you, our Engineering blog has stories about other challenges we have encountered. Visit ourEngineering career pageto find out about our open positions. Join our remote team and work (almost) anywhere. Learn about how we’re hiring to design the future together—a future that isdigital by default.
In this post I'm going to share how my teammates and I redefined the way we store one of the polymorphic associations in the Shopify codebase. I am part of the newly formed Payment Flexibility team. We work on features that empower merchants to better manage their payments and receivables on Shopify.
Code at Shopify is organized in components. As a new team, we decided to take ownership over some existing code and to move it under the component we’re responsible for (payment flexibility). This resulted in moving classes (including models) from one module to another, meaning their namespace had to change. While thinking about how we were going to move certain classes under different modules, we realized we may benefit from changing the way Rails persists a polymorphic association to a database. Our team had not yet entirely agreed on the naming of the modules and classes. We wanted to facilitate name changes during the future build phase of the project.
We decided to stop storing class names as a polymorphic type for certain records. By default, Rails stores class names as polymorphic types. We decided to instead use an arbitrary string. This article is a step by step representation of how we solved this challenge. I say representation because the classes and data used for this article are not taken from the Shopify codebase. They’re a practical example of the initial situation and the solution we applied.
I’m going to start with a short and simple reminder of what polymorphism is, then move on to a description of the problem, and finish with a detailed explanation of the solution we chose.
What is Polymorphism?
Polymorphism means that something has many forms (from the Greek “polys” for many and “morphē” for form).
Polymorphic relationship in Rails refers to a type of Active Record association. This concept is used to attach a model to another model that can be of a different type by only having to define one association.
For the purpose of this post, I’ll take the example of a Vehicle that has_one :key and the Key belongs_to :vehicle.
A Vehicle can be a Car or a Boat.
You can see here that Vehicle has many forms. The relationship between Key and Vehicle is polymorphic.
The foreign key stored on the child object (the Key record in our example) points to a single object (Vehicle) that can have different forms (Car or Boat). The form of the parent object is stored on the child object under the polymorphic_type column. The value of the polymorphic_type is equal to the class name of the parent object, "Car" or "Boat" in our example.
The code block below shows how a polymorphic association is stored in Rails.
The Issue
As I said initially, our vehicle classes had to move under another module, a change in module results in a different namespace. For this example I’ll pretend I want to change how our code is organized and put Car under the Garage module.
I go ahead and move the Car and Boat models under the new module Garage:
I’m now running into the following:
The vehicle_type column now contains "Garage::Car", which means we’ll have vehicle_type: "Car" and vehicle_type: "Garage::Car" both stored in our database.
Having these two different vehicle_type values means the Key records with vehicle_type: "Car" won’t be returned when calling a_vehicle.key. The Active Record association has to be aware of all the possible values for vehicle_type in order to find the associated record:
Both these vehicle_type values should point towards the updated model Garage::Car for our polymorphic ActiveRecord association to continue to work. The association is broken in both directions. Calling #vehicle on a Key record that has vehicle_type: "Car" won’t return the associated record:
The Idea
Once we realized changing a namespace was going to introduce complexity and a set of tasks (see next paragraph), one of my teammates said to me, “Let's stop storing class names in the database altogether. By going from a class name to an arbitrary string we could decrease the coupling between our codebase and our database. This means we could more easily change class names and namespaces if we need to in the future.” For our example, instead of storing "Garage::Car" or "Garage::Boat" why don't we just store "car" or "boat"?
To go forward with a module and classes name change, without modifying the way Active Record stores a polymorphic association, we would have to add the ability to read from several polymorphic types when setting the ActiveRecord association. We also would have had to update existing records for them to point to the new namespace. If we go back to our example, records with vehicle_type: "Garage::Car" should point towards the new Garage::Car model until we could perform a backfill of the column with the updated model class name.
In Practice: Going From Storing a Class Name to an Arbitrary String
Rails has a way to override the writing of a polymorphic_type value. It’s done by redefining the polymorhic_name method. The code below is taken from the Rails gem source code:
Let's redefine the source code above for our Garage::Car example:
When creating a Key record we now have the following:
Now we have both "Car" the class name and "car" the arbitrary string stored as vehicle_type. Having two possible values for vehicle_type brings another problem. In a polymorphic association, the target (associated record) is looked up using the single value returned in .polymorphic_name, and this is where the limitation lies. The association is only able to look for one vehicle_type value. vehicle_type is stored as the value returned by polymorphic_name when the record was created.
An example of this limitation:
Look closely at the SQL expression, and you’ll see that we’re only looking for keys with a vehicle_type = "car" (the arbitrary string). The association won’t find the Key for vehicles created before we started our code change (keys where vehicle_type = "Car"). We have to redefine our association scope so it can look for keys with vehicle_type of "Car" or "car":
Our association now becomes the following SQL expression:
The association is now looking up keys with either "car" or "Car" as vehicle_type.
Now that we can read from both the class name and new arbitrary string as a vehicle_type for our association, we can go ahead and clean up our database to only have arbitrary strings stored as vehicle_type. At Shopify, we use MaintenanceTasks. You could run a migration or a script as the one below to update your records.
Once the clean up is complete, we only have arbitrary strings stored as vehicle_type. We can go ahead and remove the .unscope on the Garage::Car and Garage::Boat association.
But Wait, All This for What?
The main benefit from this patch is that we reduced the coupling between our codebase and our database.
Not storing class names as polymorphic types means you can move your classes, rename your modules and classes, without having to touch your existing database records. All you have to do is update the class names used as keys and values in the three CLASS_MAPPING hashes. The value stored in the database will remain the same unless you change the arbitrary strings these classes and class names resolve to.
Our solution adds complexity. It’s probably not worth it for most use cases. For us it was a good trade off since we knew the naming of our modules and classes could change in the near future.
The solution I explained isn’t the one we initially adopted. We initially went an even more complex route. This post is the solution we wish we had found when we started looking into the idea of changing how a polymorphic association is stored. After a bit of research and experimentation, I came to this simplified version and thought it was worth sharing.
Diego is a software engineer on the Payment Flexibility Team. Living in the Canadian Rockies.
We want your feedback! Take our reader survey and tell us what you're interested in reading about this year.
If building systems from the ground up to solve real-world problems interests you, our Engineering blog has stories about other challenges we have encountered. Visit our Engineering career page to find out about our open positions. Join our remote team and work (almost) anywhere. Learn about how we’re hiring to design the future together—a future that is digital by default.
Let’s get this out of the way: I really, really like Tailwind. It's my preferred way to style websites, and it enables developers to build beautiful storefronts quickly with Hydrogen, our React-based framework for building custom storefronts. If you’re not familiar with Hydrogen and want to give it a quick spin, visit https://hydrogen.new.
To add Tailwind to a new Hydrogen app, you don’t have to do anything. It’s the default option. It’s literally there the moment you run npx create-hydrogen-app@latest. We bundled Tailwind with the Hydrogen starter template because we think it’s a really powerful and customizable set of tools to get building quickly.
So what’s the best way to use Tailwind in your project? Let’s start with componentization. I consider it one of the most effective ways to work with Tailwind.
Componentization with Tailwind
The first thing you’ll notice about Tailwind is that you use a bunch of CSS classes (often called “utility classes”) to build your website. That’s it—you don’t need to write CSS inside a dedicated CSS file if you don’t want to.
To decipher the code you see above:
text-center is the equivalent of setting “text-align: center;”
mb-16 indicates that there should be a good amount of margin at the bottom of the div
font-extrabold is to assign a font-weight that’s heavier than bold, but not as heavy as black
text-5xl is a way to say make this text pretty large
md:text-7xl indicates that, at the medium breakpoint, the text should be even larger. (Yes, you read that correctly: you can define responsive styles using class names instead of needing to write `@media` rules in a stylesheet! You can’t do that with regular inline styles.)
The abundance of CSS classes catches people off guard the first time they see a Tailwind website. I was one of these people, too.
One important thing to consider is that most websites are built with components these days. If you’re building a new website, it’s probably componentized on the server (think WordPress files or Rails partials) or componentized on the client (think React or Vue).
Hydrogen is built with React. This means you can use Tailwind classes within each component, and then reuse those components throughout your Hydrogen storefront without having to copy and paste a bunch of CSS classes.
The above example is from Hydrogen’s starter template. It represents a navigation that should be hidden at small breakpoints but displayed at larger breakpoints (hidden lg:block). It outputs an unordered list which displays its items in a centered way using flexbox (flex items-center justify-center). When the navigation links are hovered, their opacity changes to 80% (hover:opacity-80).
Here’s what the navigation looks like at a larger breakpoint:
Hydrogen starter template homepage
You can check out the /src/components folder to see a bunch of examples of using Tailwind classes in different components in the Hydrogen starter template.
You might be asking yourself, “What’s the difference between building React components with Tailwind and building React components with something like Bootstrap or my own custom CSS framework?”
At the end of the day, you’re still building a component-based system, just like you would in Bootstrap or a custom framework. The difference is that the classes you apply to your components in a Bootstrap world have names that are tightly coupled to the function of each component.
This makes for a more brittle system. You can imagine that if I have a custom framework where I’ve designed for a product card that contains a product title, image,and description:
Product card
Now, let’s pretend that I really like this design. I have some blog posts on my landing page, and I want to use this same card layout for those too. I also want to show an author avatar between my title and my image on those blog posts.
Unfortunately, my class names are tightly-coupled to the product component. My options are:
Just re-use my product component and grimace every time I see it being used for the wrong thing
Rename my product class names to be more generic, like “card”
Duplicate all the class definitions to a new set of classes prefixed with blog-card
I’m not faced with this same dilemma when I’m using Tailwind, since I’m using utility classes that aren’t bound to the semantic meaning of their original use: product-*. I’m free to copy and paste my Tailwind and HTML markup to a new component called <BlogCard> without having to update CSS classes or jump to a stylesheet. I can also easily extract a subset of inner markup to a dedicated component that is shared between <BlogCard> and <ProductCard> without having to deal with renaming BEM-style product-card__title classes.
What About the Learning Curve?
Another question you might have: “Why do I effectively have to learn a new language in order to be productive in Tailwind?”
It’s a fair question. The learning curve for Tailwind can be steep, especially for folks who haven’t touched CSS before. In order to be effective, you still need to have at least some knowledge of how CSS works—when to use margin, when to use padding, and how to leverage flexbox and CSS grid for layouts.
Thankfully, Tailwind’s docs are amazing. They have autocomplete search, logical grouping of CSS topics, and lots of examples. Whenever you’re using Tailwind, you’ll likely have their docs open in another browser tab. Also, Tailwind’s VSCode extension is a must-have. It makes working with Tailwind a brilliant experience in the editor because CSS classes are autocompleted along with their style representations, and you get inline swatch previews for properties like background color.
In my experience, the best way to learn Tailwind is to use it in a real project. This forces you to learn the design patterns and memorize commonly-used Tailwind classes. After working on a project for a couple hours and building up muscle memory, I found myself being way more productive using the framework than I ever was writing custom CSS.
What’s the Deal with All of These Classes?
So you’re off and running with Hydrogen and Tailwind, but maybe one thing is rubbing you the wrong way: why are there so many CSS classes? Isn’t this just like writing inline styles?
Thankfully, no, it’s not like writing inline styles. One huge benefit of Tailwind is enforced consistency and constraints. As a developer who isn’t super great at design, I know that if I’m given a blank canvas with no constraints, it’s likely that I’ll create something that is very meh. Hey, I’m trying to get better! But if I have too many options, or put another way, not enough constraints, my design leads to inconsistent choices. This manifests itself as wonky spacing between elements, subpar typography decisions, and a wild gradient of colors that mimics the result of a toddler getting unsupervised access to their parent’s makeup bag.
Tailwind offers spacing and color stops that enforce a consistent visual look:
As a developer who struggles with analysis paralysis, Tailwind’s constraints are a breath of fresh air. This is how my brain works:
Need a little padding? Use p-1.
A little more padding? OK, use p-2.
Gosh, just a little bit more? Ahh, p-4 should do the trick.
I don’t need to think about pixels, ems, rems, or percentages. And I don’t need to double check that my other hundred components adhere to the same convention since Tailwind enforces it for me. Hydrogen’s developer experience is rooted in this philosophy as well: we don’t want developers to have to think about the nitty-gritty boilerplate, so we provide it for them.
Tailwind is built in a way that it can be composed into a set of components that fit your design system. These design systems are portable.
Since Tailwind leverages utility classes, this means you can copy examples from really smart developers and designers on the Internet and paste them into your website as a starting point. This is really tough to do if you’re not using Tailwind or another utility CSS framework. Without Tailwind, you’d need to:
copy one or more CSS files
place it in whatever structure you’ve defined for your website’s CSS files
paste the HTML into your website
update the CSS classes everywhere to conform to your website’s style convention.
You can get a head start by purchasing Tailwind UI, which is a product by Tailwind Labs, the creators of Tailwind. They offer an e-commerce kit with a bunch of really useful components for building custom storefronts. You can also check out other cool Tailwind component collections like Tailwind Starter Kit, HyperUI, and daisyUI.
Because of Tailwind’s composability, copy and paste is actually a feature of Tailwind! The copy paste features of Tailwind means you can browse something like TailwindUI, copy something that strikes your fancy, and paste it into your storefront to customize without any other changes or manual CSS file updates.
Working with a Team
Maybe you work as a solo developer, but working with other developers is fun, too. You should try it! When you work on a team, everybody who edits the codebase needs to be familiar with how things are supposed to be done. Otherwise, it’s easy for a codebase to get out of hand with lots of inconsistencies between each developer’s individual choices.
Tailwind is gold for working with teams. Everyone has access to Tailwind’s docs (I’ve mentioned they’re great, by the way). Once team members get accustomed to Tailwind’s classes, they can look at any component and instantly know how the component is styled at each breakpoint. They don’t need to jump between stylesheets and component markup. They don’t need to spend a few minutes figuring out how the Sass partials work together or style mixins function. In order to be productive, they just read and write CSS classes! This is great news not only for teams but also for open-source projects.
There are so many unique choices we make as individuals that don’t necessarily contribute to a team project in a good way. One example of this is ordering CSS properties in a typical CSS file. Another example of this is naming things. Oh, this actually brings up a great point…
Not Having to Name Things is By Far the Best Part About Using Tailwind, Period
If there’s one thing you take away from this post, let it be this: I’ve spent so many hours of my life as a developer trying to decide what to name things. When I use Tailwind, I don’t have to use that time naming things. Instead, I go for a walk outside. I spend time with my family. I keep writing the screenplay I’ve been putting off for so long.
It’s a hard thing to understand unless you’ve spent some time using Tailwind, not naming things. Plus, when you’re working with other people, you don’t have to quibble over naming conventions in PRs or accrue technical debt when a component’s scope changes slightly and its class names no longer make sense. Granted, you’ll still have to name some things—like components—in your codebase. However, Tailwind’s utility classes grant you the mental freedom from having to assign semantic class names that represent a chunk of styles.
Hydrogen and Tailwind: A Perfect Match
I think you’ll enjoy using Tailwind inside Hydrogen. I didn’t even find an adequate place to mention the fact that Tailwind allows you to use dark mode out of the box! Or that the Tailwind team built a complementary JavaScript library called HeadlessUI that helps you create accessible interactive experiences with any CSS styles, not just Tailwind.
If you finished reading this post, and you still don’t like Tailwind—that’s fine! I don’t think I’ll convince you with this single blog post. But I’d encourage you to give it a shot within the context of a Hydrogen storefront, because I think Tailwind and Hydrogen make for a good combination. Tailwind’s utility classes lend themselves to encapsulation inside Hydrogen’s commerce components. Developers get the best of both worlds with ready-made starter components along with composable styles. Tailwind lets you focus on what is important: building out a Hydrogen storefront and selling products to your customers.
Josh Larson is a Senior Staff Developer at Shopify working on the Hydrogen team. He works remotely from Des Moines, Iowa. Outside of work, he enjoys spending time with his wife, son, and dogs.
Wherever you are, your next journey starts here! If building systems from the ground up to solve real-world problems interests you, our Engineering blog has stories about other challenges we have encountered. Intrigued? Visit our Engineering career page to find out about our open positions and learn about Digital by Design.
When my team and I started experimenting with React Server Components (RSC) while building Hydrogen, our React-based framework for building custom storefronts, I was incredibly excited. Not only for the impact this would have on Hydrogen, and the future of ecommerce experience (goodbye large bundle sizes, hello improved buying experiences!), but also for the selfish reason that many of us developers have when encountering new tech: this is going to be fun.
And, indeed, it was… but it was also pretty challenging. RSC is a paradigm shift and, personally, it took some getting used to. I started out building way too many client components and very few server components. My client components were larger than they needed to be and contained logic in them that really had no business existing on the client. Eventually, after months of trial and error and refactoring, it eventually clicked for me. I found it (dare I say it?) easy to build server and client components!
In this post, I’m going to dive into the patterns and best practices for RSC that both myself and my team learned while building Hydrogen. My goal is to increase your understanding of how to approach writing components in an RSC application and cut down your trial-and-error time. Let’s go!
Default to Shared Components
When you need to build a component from scratch in a RSC application, start out with a shared component. Shared components’ entire functionality can execute in both server and client contexts without any issues. They’re a natural middle ground between client and server components and a great starting point for development.
Starting in the middle helps you ask the right questions that lead you to build the right type of component. You’ll have to ask yourself: “Can this bit of code run only on the client?” and, similarly, “Should this bit of code execute on the client?” The next section identifies some of the questions that you should ask.
In our experience, the worst approach you can take in a RSC application is to default to always building client components. While this will get you up and running quickly, your application ends up with a larger than necessary bundle size, containing too many client components that are better suited as server components.
Pivot to a Client Component in Rare Cases
The majority of the components in your RSC application should be server components, so you’ll need to analyze the use case carefully when determining if a client component is even necessary.
In our experience, there are very specific use cases in which a shared component should be pivoted to a client component. Generally, it’s not necessary to convert the entire component into a client component, only the logic necessary for the client needs to be extracted out into a client component. These use cases include
incorporating client side interactivity
using useState or useReducer
using lifecycle rendering logic (for example, useEffect)
making use of a third-party library that doesn’t support RSC
using browser APIs that aren’t supported on the server.
An important note on this: don’t just blindly convert your whole shared component into a client component. Rather, intentionally extract just the specific functionality you need into a client component. This helps keep your client component and bundle size as small as possible. I’ll show you some examples at the end of this post.
Pivot to a Server Component as Often as Possible
If the component doesn’t include any of the client component use cases, then it should be pivoted to a server component if it’s one of the following use cases:
The component includes code that shouldn’t be exposed on the client, like proprietary business logic and secrets.
The component won’t be used by a client component.
The code never executes on the client (to the best of your knowledge).
The code needs to access the filesystem or databases (which aren’t available on the client).
The code fetches data from the storefront API (in Hydrogen-specific cases).
If the component is used by a client component, dig into the use cases and implementation. It’s likely you could pass the component through to the client component as a child instead of having the client component import it and use it directly. This eliminates the need to convert your component into a client component, since client components can use server components when they’re passed into them as children.
Explore Some Examples
These are a lot of things to keep in mind, so let’s try out some examples with the Hydrogen starter template.
Newsletter Sign-up
Our first example is a component that allows buyers to sign up to my online store’s newsletter. It appears in the footer on every page, and it looks like this:
Newsletter sign-up component
We’ll start with a shared component called NewsletterSignup.jsx:
In this component, we have two pieces of client interactivity (input field and submit button) that indicates that this component, as currently written, can’t be a shared component.
Instead of fully converting this into a client component, we’re going to extract just the client functionality into a separate NewsletterSignupForm.client.jsx component:
And then update the NewsletterSignup component to use this client component:
It would be tempting to stop here and keep the NewsletterSignup component as a shared component. However, I know for a fact that I want this component to only be used in the footer of my online store, and my footer component is a server component. There’s no need for this to be a shared component and be part of the client bundle, so we can safely change this to a server component by simply renaming it to NewsletterSignup.server.jsx.
For the next example, let’s add a product FAQ section to product pages. The content here is static and will be the same for each product in my online store. The interaction from the buyer can expand or collapse the content. It looks like this:
Product FAQ content
Let’s start with a shared ProductFAQs.jsx component:
Next, we’ll add it to our product page. The ProductDetails.client component is used for the main content of this page, so it’s tempting to turn the ProductFAQs into a client component so that the ProductDetails component can use it directly. However, we can avoid this by passing the ProductFAQs through to the product/[handle].server.jsx page:
And then update the ProductDetails component to use the children:
Next, we want to add the client interactivity to the ProductFAQs component. Again, it would be tempting to convert the ProductFAQ component from a shared component into a client component, but that isn't necessary. The interactivity is only for expanding and collapsing the FAQ content—the content itself is hardcoded and doesn’t need to be part of the client bundle. What we’ll do instead is extract the client interactivity into an exclusively client component, Accordion.client.jsx:
We’ll update the ProductFAQs component to use the Accordion:
At this point, there’s no reason for the ProductFAQs component to remain a shared component. All the client interactivity is extracted out and, similar to the NewsletterSignup component, I know this component will never be used by a client component. All that’s left now is to:
rename the file from ProductFAQs.jsx to ProductFAQs.server.jsx
update the import statement in product/[handle].server.jsx
React Server Components are a paradigm shift, and writing a component for an RSC application can take some getting used to. Keep the following in mind while you’re building:
Start out with a shared component.
Extract functionality into a client component in specific cases.
Pivot to a server component if the code never needs to or never should execute on the client.
Happy coding!
Cathryn is a Staff Front End Developer on Shopify’s Checkout team and a founding member of Hydrogen. She works remotely in Montreal, Canada. When not coding, she’s usually playing with her dog, crafting, or reading.
Wherever you are, your next journey starts here! If building systems from the ground up to solve real-world problems interests you, our Engineering blog has stories about other challenges we have encountered. Intrigued? Visit our Engineering career page to find out about our open positions and learn about Digital by Design.
Last year we released Hydrogen, our React-based framework for building custom storefronts. Hydrogen allows developers to build fast, dynamic commerce experiences by leveraging streaming server-side rendering, React Server Components, and caching APIs. Hydrogen is currently in developer preview and I'm excited to show you how you can rapidly build out a simple product page by leaning on Hydrogen's components.
We’ll be using Hydrogen to build a product display page.
Previously, constructing a custom storefront required developers to manually manipulate data and create custom components for each page. Hydrogen accelerates this process by offering Shopify-specific commerce components, hooks, and utilities that allows developers to focus on the fun stuff - building unique storefront experiences.
Most of the files you’ll work with are located in the /src directory. This directory will contain routes, components and the main app component (App.server.jsx). For an in-depth overview, see the getting started guide.
Add a styling library
We’ll be using the Tailwind CSS framework to style the product page today. You can learn more about Tailwind on Hydrogen here.
Stop the StackBlitz development server (CTRL + C)
Install tailwindcss and its peer dependencies, and generate the tailwind.config.js and postcss.config.js files: $ npm install -D tailwindcss @tailwindcss/typography postcss autoprefixer $ npx tailwindcss init -p
Add the paths to the template files in your tailwind.config.js file:
Add Tailwind directives to /src/index.css:
Start the development server again. $ vite
You now have access to Tailwind classes, make a change to the Index route and watch the styling kick in:
A styled heading
Creating a Product route
Hydrogen uses file-based routing. To register a /products/snowboard route, we can create a /src/products/snowboard.server.jsx component.
Given product handles are dynamic, we want to catch all /products/:handle requests. We can do this by using square brackets to define a parameter.
Create a new file /src/routes/products/[handle].server.jsx and export a Product component. We can lean on the useRouterParam hook to retrieve the handle parameter:
Pointing your browser to /products/the-full-stack renders a simple header and the the-full-stack handle on screen:
A product route displaying the product handle.
Fetching data
Hydrogen communicates with Shopify via the Storefront API which makes it possible for customers to view products and collections, add products to a cart, and check out. Hydrogen conveniently exposes a useShopQuery hook to query the Storefront API, with an access token already configured (the details can be found in /shopify.config.js).
Out of the box, the Demo Store and Hello World templates are connected to a Hydrogen Preview store, which has a number of snowboard collections, products, variants and media - ideal for testing.
Import the useShopQuery hook and use the dynamic product handle to fetch a product’s title and description:
By providing a prose class to the description, Tailwind CSS Typography plugin adds typographic defaults to the vanilla HTML pulled from the Shopify Admin.
An product page with a title and description.
Using state
Hydrogen implements React Server Components which allows the server and the client (the browser) to collaborate in rendering the React application (learn more). By default, all routes are server components.
We'll be using a ProductOptionsProvider component to set up a context with state that tracks the selected variant and options. To use state, create a client component (/src/components/ProductDetails.client.jsx) and import it into your server component (/src/routes/products/[handle].server.jsx).
Update the product query to fetch product media, variants and options, and then wrap the product details in a ProductOptionsProvider component.
With the context in place, it's a breeze to build out the interactive parts of the product page, like the variant selector. By leaning on the ProductOptions hook we can get a list of options and manage selected option state. Passing the selected variant ID to ProductPrice dynamically updates the selected variant’s price.
A variant picker has been added to the product page.
Adding a buy button
Hydrogen exports a BuyNowButton component which sends customers to checkout. Get the selected variant ID, and pass it to a BuyNowButton. If the selected variant is out of stock, display a message:
Media gallery & finishing touches
With a functioning product page in place, create a media gallery (you guessed it, there's a component for that too) and add add some additional styling:
Taking advantage of these components, hooks and utilities allows you to skip many of the repetitive parts of building a custom storefront, speeding up the development process.
I hope Hydrogen has piqued your interest. Explore the docs or build a complete storefront by following the new tutorial and take Hydrogen for a spin on your next project!
Scott’s a Developer Advocate at Shopify, located on the east coast of Australia and formerly a Shopify app developer and developer bootcamp coach. When he's not tinkering with code, you'll find him checking the surf or hanging out with his family.
Wherever you are, your next journey starts here! If building systems from the ground up to solve real-world problems interests you, our Engineering blog has stories about other challenges we have encountered. Intrigued? Visit our Engineering career page to find out about our open positions and learn about Digital by Default.
You may have heard that 2021 was Shopify’s biggest Black Friday Cyber Monday (BFCM) ever. This four-day period was monumental for both Shopify’s merchants and our engineering teams.
Last year’s numbers capture a moment in time but can also help us predict what’s to come in the year ahead. On our cloud in 2021, our peak BFCM traffic surpassed 32 million app server requests per minute (RPM). In the same time period our load balancers peaked at more than 34 million RPM. To put that in perspective, this means that the equivalent of Texas’s total population hit our load balancers in a given minute. One flash sale—a short-lived sale that exceeds our checkout per minute threshold—even generated enough load to use over 20% of our total computing capacity at its peak.
During BFCM 2021, we also:
sent nearly 145 million emails
averaged 30 TB per minute of egress network traffic
handled 42 billion API calls and delivered 13 billion webhooks
wrote 3.18 PB and read 15 PB of data from our storefront caching infrastructure
performed over 11 Million queries per second and delivered 11 terabytes per second read I/O with our MySQL database fleet
The year ahead poses even bigger challenges for our engineers, data scientists, user experience designers, and product managers. More BFCM sales are happening on mobile devices. More people are shopping on social media. Commerce is happening across a growing array of platforms and buyers expect a fast and consistent experience. If the metaverse becomes a reality, there will be commerce opportunities within that world that need to be explored. What does a flash sale look like in the metaverse and how does that play out?
Shopify's technical stats from BFCM 2021
If the data and trends above tell us anything, it's that there’s no getting around the fact that flash sales, huge floods of web traffic, and many different buying environments are a big part of the future of commerce. The questions for me are: What are the enduring challenges for the engineering teams working to enable this incredible growth in the next five to ten years? How do we build scalable products and infrastructure so millions of merchants can go from zero to IPO—and beyond? Engineering at Shopify is about solving challenges and building resilient systems so merchants can focus on their business instead of technology.
Here are a few things we’re planning on doing in 2022 to work quickly in a world that’s growing rapidly, becoming more global, and at the same time moving closer to where merchants do business and where buyers are shopping.
As an example, we split out our storefront rendering process from the modular monolith repo to make sure merchants (and their customers) get the fastest online shopping experience possible. When we were done with the split and some code refactoring work, the results were four times faster cache fill rates and five times faster page render times. Also, pulling the storefront renderer out means it can now be deployed in geographies around the planet without having to deploy our full Rails monolith. The closer we can render the storefront to the buyer, the fewer round-trips between the store and the browser need to be made, again improving overall storefront performance. In 2022, we’re going to continue exploring majestic monoliths. We see that engineers working on repos that directly improve merchant performance, like storefront rendering, iterate and deploy quickly. This model also allows us to put our developer experience first and provide a simpler setup with tighter coupling with our debugging and resiliency tools.
We are leveraging new cloud development platforms to work more efficiently on a global scale. This year, we’ll spend a lot of time making sure developers can create impact fast—in minutes not hours. We’re moving the majority of our developers into our cloud development environment, called Spin. Devs can spin up (pun intended) a full development environment in seconds as opposed to minutes. You can even have multiple environments for experimentation to share work-in-progress with teammates. (We plan to share more about Spin in the future.)
Another big part of this year will be about building on this cloud development platform foundation to make our developer workflow faster and even smoother. We also moved all of our engineering to working on Apple M1 Macbook Pro laptops and these powerful devices, combined with Spin, are already making developers much more productive. Spin creates opportunities for us to build much improved IDE and browser extensions for enhanced productivity and delight, and an exciting opportunity for us to explore new ways to solve developer problems at scale that just weren’t possible in our previous local development environment paradigm.
We are making load testing a more natural part of the development process. To prepare for BFCM 2021, we began load testing in July and ran the highest load test in Shopify’s history: a load balancer peak of 50.7 million RPM. But, flash sales that spike in minutes are not as predictable in their load requirements as a seasonal growth pattern like BFCM. To help prepare our infrastructure and products to handle larger and spikier scale, we’re continuing to improve our load testing. These load tests, built in-house, help our teams understand how products handle the larger platform-wide surge scenarios. Our load testing helps test product sales regardless if they are exclusively online, in-person using our retail POS products, or a combination of both. Automating and combining load tests as part of our product development processes is absolutely critical to avoid performance issues as we scale alongside our merchants.
The practice of load testing at Shopify has come a long way from where we started at Shopify, but there's always more we can do. In this video Bart shares a look at how this work started and a look at where we hope to take this work in the future. 🔮
These are a few ways we’re making it as easy as possible for developers to do the best work of their lives. We want to have the right tools so we can be creative about commerce—not “How do I set up my environment?” or “How does my code get built?” Engineers want to work at scale, ship impactful changes on a regular cadence, and work with a great team.
Speaking of great teams, a team of engineers from Shopify and Github built YJIT, a new Just-in-time (JIT) compiler that merged with Ruby 3.1. It’s 31% faster than interpreted CRuby and 26% faster than MJIT, reaching near-peak performance after a single iteration of any benchmark. It’s having a huge impact on the Ruby community inside and outside of Shopify and accelerating lots of production code execution times.
What isn’t changing in 2022: We remain opinionated about our tech stack. We’re all in on Rails and doubling down on React Native for mobile. We are going to continue to make big bets on our infrastructure, on building delightful developer environments, and making sure that we’re building for the success of all of our merchants. BFCM 2022? Bring it on.
Allan Leinwand is Chief Technology Officer at Shopify leading the engineering and data teams. Allan was previously SVP of Engineering at Slack and CTO at ServiceNow. He co-founded and held senior leadership positions at multiple companies, has authored books, and ventured to the dark side as a venture capital investor for seven years. He’s passionate about helping Shopify be the best commerce platform for everyone!
Wherever you are, your next journey starts here! If building systems from the ground up to solve real-world problems interests you, our Engineering blog has stories about other challenges we have encountered. Intrigued? Visit our Engineering career page to find out about our open positions and learn about Digital by Design.
One thing I’ve always appreciated about Shopify is the emphasis on range: the ability to navigate across expertise. Range isn’t just a book we love at Shopify, it’s built into our entire outlook. If you’re a developer at Shopify, you could start your career building data science infrastructure, but decide a few years later to pivot to Ruby internals.
The emphasis on range inspires me. In my coding journey, I’ve loved ranging. I started building AppleBasic programs in 4th grade. Years later my high school friends would try to one-up each other, obsessed with the math behind 3D games.
What does any of this have to do with search?
While most would see search and discovery as some kind of deep specialty: it actually requires an intense amount of range. Many search teams focus too much on specialists—in the words of my former colleague Charlie Hull, teams always wanted to hire “magical search unicorns” that often don’t exist. Instead, they tended to have siloed data and engineers working on search.
I’ve taken these painful experiences to heart when helping build Shopify’s search team. I want to share why range is a core team principle that separates us from the herd and sets us up for long-term success. (And of course, why you should join, even if you’re not a magical search unicorn!).
Lack of Range: Dysfunction between Data and Engineering
In reality, nobody on our search team is an “engineer” or “data scientist”. Instead they have the range to be both at the same time. In fact, most of the team has a wide range when it comes to past jobs or hobbies: from linguists to physicists! After all, good decisions require fitting both data science and engineering skills into one brain.
Why? Because of the trade-offs.
Pure data scientists or engineers waste time making poor decisions because they lack full context. They won’t see the other competency’s constraints. That’s why generalizing beyond our expertise is a major part of how Shopifolk work on every project. And that’s precisely why we’ve brought this value to the search domain.
Consider life in the data silo: without engineering context, data could easily chase the bleeding edge machine learning research without considering how to deliver to production. They develop a new model, decide shipping to production isn’t their job and instead give the new model to engineers to translate.
In the engineer silo, they don’t have the context needed to make the important tradeoffs. Can they know where to tweak the model to remove bloat that doesn’t hurt relevance? Can pure engineers make the dozens of minute-by-minute decisions they need to optimize relevance, performance, and stability? Without the data context in their brain, they’ll fail, leading to suboptimal solutions!
Great engineering is about making the best decision given the constraints. So when an engineer lacks one crucial piece of know-how (data and relevance), they won’t arrive at the optimal solution between relevance, performance, stability, and other product factors. They’ll blindly implement the model, unsure where to tweak, leading to disastrous results in one of these dimensions.
That leads me to the other end of the trade-off spectrum: the data team creates a reasonable solution, but the infrastructure won’t bend. Unfortunately the engineers, specifically skilled in performance and reliability, might not see the full search quality spectrum of relevance, experience, and performance. Their incentives focus on answering whether search satisfies a service-level agreement? Does it keep me from being woken up at 3AM when I’m on call? With only those constraints, why would an engineer care to build a complicated looking search relevance model that only runs the risk of creating more complexity and instability?
Coordination between two groups—each with only half of the skills needed to make decisions—creates dysfunction. It adds needless time to production deployment and creates politics.
Range: The Solution to Dysfunction between Data and Engineering
At Shopify, we have one team with members from both competencies. We draw very few lines between “data” and “engineering” work. Instead we have “search” work.
Engineers on our team must grow data science skills—they learn to build and run experiments. They think scientifically and evaluate the quality of a model. Data scientists find themselves pushed to become good engineers. They must build high quality, performant, and testable code. When they build a model, it’s not just a random idea in a notebook, it’s on them to get it to production and create a maintainable system.
Why does this matter? Because search, like all software development, requires making dozens of deeply intricate tradeoffs between correctness, scalability, performance, and maintainability. Good decisions require fitting both data science and engineering skills in one brain. An elegant solution to a problem is the simplest one that satisfies all of the constraints. If you can only fit half the constraints in your head, you’ll fail to see the best solution that makes search smart, fast, and scalable.
A close partnership between data and engineering organizations makes this possible. Management on both sides has experience and commitment to close collaboration and partnership. At the level of individual contributors, we don’t think of ourselves as two teams. We’re one team, with individuals that report to a few different leads. We organize, plan, and execute together. We don’t carve out territorial fiefdoms.
Data and Engineering Range is the Future
When you look at the problems of tomorrow, they’ll increasingly be less about point-and-click interactivity. They’ll frequently include some “smart” user interaction. The user wants to:
talk to the system
start with a curated set of possibilities tailored to them and fine tune them with their preferences
be given options or taken on a journey that doesn’t filter out obvious paths they won’t care about.
This isn’t just the cool stuff people add on to an existing application: it’s increasingly the core part of what’s being built.
I see search and discovery at Shopify as just the beginning. The more personalized or conversational products we build, like those listed above, the more engineers must have the range to push into data (and vice versa). The future isn’t specialization within data science and engineering—it’s having the range to move between both.
Doug Turnbull is a Sr. Staff Engineer at Shopify working on search and discovery. Doug wrote Relevant Search and contributed to AI Powered Search. Doug also blogs heavily at Shopify and his personal site. Currently Doug’s passion includes incubating search and discovery skills at Shopify, planning technical initiatives in search and discovery, and collaborating with peers to make commerce better for everyone through search!
Wherever you are, your next journey starts here! If building systems from the ground up to solve real-world problems interests you, our Engineering blog has stories about other challenges we have encountered. Intrigued? Visit our Engineering career page to find out about our open positions and learn about Digital by Default.
Shopify is one of the world's largest e-commerce platforms. With millions of merchants worldwide, we support an increasingly diverse set of use cases, and we wouldn't be successful at it without our developer community. Developers build apps that add immense value to Shopify and its merchants, and solve problems such as marketing automation, sales channel integrations, and product sourcing.
In this post, we will take a deep dive into the latest generation of our technology that allows developers to extend Shopify’s UI. With this technology, developers can better integrate with the Shopify platform and offer native experiences and rich interactions that fit into users' natural workflow on the platform.
3rd party extension adding a post-purchase page directly into the Shopify checkout
To put the technical challenges into context, it's important to understand our main objectives and requirements:
The user experience of 3rd party extensions must be consistent with Shopify's native content in terms of look & feel, performance, and accessibility features.
Developers should be able to extend Shopify using standard technologies they are already familiar with.
Shopify needs to run extensions in a secure and reliable manner, and prevent them from negatively impacting the platform (naively or maliciously).
Extensions should offer the same delightful experience across all supported platforms (web, iOS, Android).
With these requirements in mind, it's time to peel the onion.
Remote Rendering
At the heart of our solution is a technique we call remote rendering. With remote rendering, we separate the code that defines the UI from the code that renders it, and have the two communicate via message passing. This technique fits our use case very well because extensions (code that defines UI) are typically 3rd party code that needs to run in a restricted sandbox environment, while the host (code that renders UI) is part of the main application.
Separating extensions (3rd party code) from host (1st party code)
Communication between an extension and a host is done via a MessageChannel. Using message passing for all communication means that hosts and extensions are completely agnostic of each other’s implementation and can be implemented using different languages. In fact, at Shopify, we have implemented hosts in JavaScript, Kotlin, and Swift to provide cross-platform support.
The remote-ui Library
Remote rendering gives us the flexibility we need, but it also introduces non-trivial technical challenges such as defining an efficient message-passing protocol, implementing function calls using message passing (aka remote procedure call), and applying UI updates in a performant way. These challenges (and more) are tackled by remote-ui, an open-source library developed at Shopify.
Let's take a closer look at some of the fundamental building blocks that remote-ui offers and how these building blocks fit together.
Update (April 9, 2024): we recently renamed remote-ui to Remote DOM. The new version of the library uses the full browser DOM API to manage UI components in an extension’s sandbox, instead of the DOM-like Remote Root object provided by remote-ui. Other aspects of our extension approach, including the RPC layer described below, continue to work similarly with the new library. We’ll be migrating UI extensions to use this more flexible DOM-based approach in a future API version.
RPC
At the lower level, the @remote-ui/rpc package provides a powerful remote procedure call (RPC) abstraction. The key feature of this RPC layer is the ability for functions to be passed (and called) across a postMessage interface, supporting the common need for passing event callbacks.
Making remote procedure calls using endpoint.call (script1.js) and endpoint.expose (script2.js)
@remote-ui/rpc introduces the concept of an endpoint for exposing functions and calling them remotely. Under the hood, the library uses Promise and Proxy objects to abstract away the details of the underlying message-passing protocol.
It's also worth mentioning that remote-ui’s RPC has very smart automatic memory management. This feature is especially useful when rendering UI, since properties (such as event handlers) can be automatically retained and released as UI component mount and unmount.
Remote Root
After RPC, the next fundamental building block is the RemoteRoot which provides a familiar DOM-like API for defining and manipulating a UI component tree. Under the hood, RemoteRoot uses RPC to serialize UI updates as JSON messages and send them to the host.
For more details on the implementation of RemoteRoot, see the documentation and source code of the @remote-ui/core package.
Remote Receiver
The "opposite side" of a RemoteRoot is a RemoteReceiver. It receives UI updates (JSON messages sent from a remote root) and reconstructs the remote component tree locally. The remote component tree can then be rendered using native components.
Basic example setting up a RemoteRoot and RemoteReceiver to work together (host.jsx and extension.js)
With RemoteRoot and RemoteReceiver we are very close to having an implementation of the remote rendering pattern. Extensions can define the UI as a remote tree, and that tree gets reconstructed on the host. The only missing thing is for the host to traverse the tree and render it using native UI components.
DOM Receiver
remote-ui provides a number of packages that make it easy to convert a remote component tree to a native component tree. For example, a DomReceiver can be initialized with minimal configuration and render a remote root into the DOM. It abstracts away the underlying details of traversing the tree, converting remote components to DOM elements, and attaching event handlers.
In the snippet above, we create a receiver that will render the remote tree inside a DOM element with the id container. The receiver will convert Button and LineBreak remote components to button and br DOM elements, respectively. It will also automatically convert any prop starting with on into an event listener.
The DomReceiver provides a convenient way for a host to map between remote components and their native implementations, but it’s not a great fit for our use case at Shopify. Our frontend application is built using React, so we need a receiver that manipulates React components (instead of manipulating DOM elements directly).
Luckily, the @remote-ui/react package has everything we need: a receiver (that receives UI updates from the remote root), a controller (that maps remote components to their native implementations), and the RemoteRenderer React component to hook them up.
There's nothing special about the component implementations passed to the controller; they are just regular React components:
However, there's a part of the code that is worth taking a closer look at:
// Run 3rd party script in a sandbox environment

// with the receiver as a communication channel ...
Sandboxing
When we introduced the concept of remote rendering, our high-level diagram included only two boxes, extension and host. In practice, the diagram is slightly more complex.
The sandbox is an additional layer of indirection between the host and the extension
The sandbox, an additional layer of indirection between the host and the extension, provides platform developers with more control. The sandbox code runs in an isolated environment (such as a web worker) and loads extensions in a safe and secure manner. In addition to that, by keeping all boilerplate code as part of the sandbox, extension developers get a simpler interface to implement.
Let's look at a simple sandbox implementation that allows us to run 3rd party code and acts as “the glue” between 3rd party extensions and our host.
The sandbox allows a host to load extension code from an external URL. When the extension is loaded, it will register itself as a callback function. After the extension finishes loading, the host can render it (that is, call the registered callback).
Arguments passed to the render function (from the host) provide it with everything it needs. remoteChannel is used for communicating UI updates with the host, and api is an arbitrary object containing any native functionality that the host wants to make available to the extension.
Let's see how a host can use this sandbox:
In the code snippet above, the host makes a setTitle function available for the extension to use. Here is what the corresponding extension script might look like:
Notice that 3rd party extension code isn't aware of any underlying aspects of RPC. It only needs to know that the api (that the host will pass) contains a setTitle function.
Implementing a Production Sandbox
The implementation above can give you a good sense of our architecture. For the sake of simplicity, we omitted details such as error handling and support for registering multiple extension callbacks.
In addition to that, our production sandbox restricts the JavaScript environment where untrusted code runs. Some globals (such as importScripts) are made unavailable and others are replaced with safer versions (such as fetch, which is restricted to specific domains). Also, the sandbox script itself is loaded from a separate domain so that the browser provides extra security constraints.
Finally, to have cross-platform support, we implemented our sandbox on three different platforms using web workers (web), web views (Android), and JsCore (iOS).
What’s Next?
The technology we presented in this blog post is relatively new and is currently used to power two types of extensions, product subscriptions and post-purchase, in two different platform areas.
We are truly excited about the potential we’re unlocking, and we also know that there's a lot of work ahead of us. Our plans include improving the experience of 3rd party developers, supporting new UI patterns as they come up, and making more areas of the platform extensibile.
Joey Freund is a manager on the core extensibility team, focusing on building tools that let Shopify developers extend our platform to make it a perfect fit for every merchant.
Wherever you are, your next journey starts here! If building systems from the ground up to solve real-world problems interests you, our Engineering blog has stories about other challenges we have encountered. Intrigued? Visit our Engineering career page to find out about our open positions and learn about Digital by Default.
The future of commerce is dynamic, contextual, and personalized. Hydrogen is a React-based framework for building custom and creative storefronts giving developers everything they need to start fast, build fast, and deliver the best personalized and dynamic buyer experiences powered by Shopify’s platform and APIs. We’ve built and designed Hydrogen to meet the three needs of commerce:
fast user experience: fast loading and responsive
best-in-class merchant capabilities: personalized, contextual, and dynamic commerce
great developer experience: easy, maintainable, and fun.
Hydrogen provides optimized React components enabling you to start fast.
These objectives have inherent tension that’s important to acknowledge. You can achieve fast loading through static generation and edge delivery, but you must forgo or make personalization a client-side concern that results in a deferred display of critical content. Vice versa, rendering dynamic responses from the server implies a slower initial render but, when done correctly, can deliver better commerce and shopping experience. However, delivering efficient streaming server-side rendering for React-powered storefronts, and smart server and client caching, is a non-trivial and unsolved developer experience hurdle for most teams.
Hydrogen is built and optimized to power personalized, contextual, and dynamic commerce. Fast and efficient server-side rendering with high-performance storefront data access is the prerequisite for such experiences. To optimize the user experience, we leverage a collection of strategies that work together:
There’s a lot to unpack here, let’s take a closer look at each one.
Streaming Server-side Rendering
Consider a product page that contains a significant amount of buyer personalized content: a localized description and price for a given product, a dynamic list of recommended products powered by purchase and navigation history, a custom call to action (CTA) or promotion banner, and the assignment to one or several multivariate A/B tests.
A client-side strategy would, likely, result in a fast render of an empty product page skeleton, with a series of post-render, browser-initiated fetches to retrieve and render the required content. These client-initiated roundtrips quickly add up to a subpar user experience.
Client-side rendering vs. server-side rendering
The client-side rendering (CSR) strategy typically results in a delayed display of critical page content—that is, slow LCP. An alternative strategy is to server-side render (SSR)—fetch the data on the server and return it in the response—that helps eliminate RTTs and allows first and largest contentful paints to fire close together, but at a cost of a slow time-to-first-byte (TTFB) because the server is blocked on the data. This is where and why streaming SSR is a critical optimization.
Streaming server-side rendering unlocks fast, non-blocking first render
Fast TTFB: the browser streams the HTML page shell without blocking the server-side data fetch. This is in contrast to “standard” SSR where TTFB is blocked until all data queries are resolved.
Progressive hydration: as server-side data fetches are resolved, the data is streamed within the HTML response, and the React runtime progressively hydrates the state of each component, all without extra client round trips or blocking on rendering the full component tree. This also means that individual components can show custom loading states as the page is streamed and constructed by the browser.
The ability to stream and progressively hydrate and render the application unlocks fast TTFB and eliminates the client-side waterfall of CSR—it’s a perfect fit for the world of dynamic and high-performance commerce.
React Server Components
“Server Components allow developers to build apps that span the server and client, combining the rich interactivity of client-side apps with the improved performance of traditional server rendering.” —RFC: React Server Components
Server components are another building block that we believe (and have been collaborating on with the React core team) is critical to delivering high-performance storefronts. RSC enables separation of concerns between client and server logic and components that enables a host downstream benefits:
server-only code that has zero impact on bundle size and reduces bundle sizes
server-side access to custom and private server-side data sources
seamless integration and well-defined protocol for server+client components
streaming rendering and progressive hydration
subtree and component-level updates that preserve client-state
server and client code sharing where appropriate.
Server components are a new building block for most React developers and have a learning curve, but, after working with them for the last ten months, we’re confident in the architecture and performance benefits that they unlock. If you haven’t already, we encourage you to read the RFC, watch the overview video, and dive into Hydrogen docs on RSC.
Efficient Data Fetching, Colocation, and Caching
Delivering fast server-side responses requires fast and efficient first party (Shopify) and third party data access. When deployed on Oxygen—a distributed, Shopify hosted V8 Isolate-powered worker runtime—the Hydrogen server components query the Storefront API with localhost speed: store data is colocated and milliseconds away. For third party fetches, the runtime exposes standard Fetch API enhanced with smart cache defaults and configurable caching strategies:
smart default caching policy: key generation and cache TTLs
ability to override and customize cache keys, TTLs, and caching policies
built-in support for asynchronous data refresh via stale-while-revalidate.
Adopting Hydrogen doesn’t mean all data must be fetched from the server. On the contrary, it’s good practice to defer or lazyload non-critical content from the client. Below the fold or non-critical content can be loaded on the client using regular React patterns and browser APIs, for example, through use of IntersectionObserver to determine when content is on or soon to be on screen and loaded on demand.
Similarly, there’s no requirement that all requests are server-rendered. Pages and subrequests with static or infrequently updated content can be served from the edge. Hydrogen is built to give developers the flexibility to deliver the critical personalized and contextual content, rendered by the server, with the best possible performance while still giving you full access to the power of client-side fetching and interactivity of any React application.
The important consideration isn’t which architecture to adopt, but when you should be using server-side rendering, client-side fetching, and edge delivery to provide the best commerce experience—a decision that can be made at a page and component level.
For example, an about or a marketing page that’s typically static can and should be safely cached, served directly from the CDN edge, and asynchronously revalidated with the help of a stale-while-revalidate strategy. The opt-in to edge serving is a few keystrokes away for any response on a Hydrogen storefront. This capability, combined with granular and optimized subrequest—powered by the fetch API we covered above—caching gives full control over data freshness and the revalidation strategy.
Putting It All Together
Delivering a high-performance, dynamic, contextual, and personalized commerce experience requires layers of optimizations at each layer of the stack. Historically, this has been the domain of a few, well-resourced engineering teams. The goal of Hydrogen and Oxygen is to level the playing field:
the framework abstracts all the streaming
the components are tuned to speak to Shopify APIs
the Oxygen runtime colocates and distributes rendering around the globe.
Adopting Hydrogen and Oxygen should, we hope, enable developers to focus on building amazing commerce experiences, instead of the undifferentiated technology plumbing and production operations to power a modern and resilient storefront.
Ilya Grigorik is a Principal Engineer at Shopify and author of High Performance Browser Networking (O'Reilly), on a mission to supercharge commerce and empower entrepreneurs around the world.
Wherever you are, your next journey starts here! If building systems from the ground up to solve real-world problems interests you, our Engineering blog has stories about other challenges we have encountered. Intrigued? Visit our Engineering career page to find out about our open positions and learn about Digital by Default.
In 2020, Google introduced unified guidance for great user experience (UX) on the web called Core Web Vitals. It’s proposed to evaluate specific metrics and have numerical estimates for such a multifaceted discipline. Current metrics focus on loading, interactivity, and visual stability. You might think, “Nice stuff, thank you, Google. I’ll save this to my bookmarks and look into it once the time comes for nice-to-have investigations!” But before deciding, have a closer look into the following. This year, Google implemented the metrics of Core Web Vitals in the Search Engine ranking algorithm as one of the factors. To be precise, the rollout of page experience in ranking systems began in mid-June of 2021 and completed at the end of August.
Does that mean that we should notice a completely different ranking of Google Search results in September already? Or the horror case, our websites to be shown in the s-e-c-o-n-d Search Engine Results Page (SERP)? Drastic changes won’t appear overnight, but the update will undoubtedly influence the future of ranking. First of all, the usability of web pages is only one factor that influences ranking. Meaning of inserted query, the relevance of a page, quality of sources, context, and settings are other “big influencers” deciding the final results. Secondly, most websites are in the same boat getting “not great, not terrible” grades. According to Google Core Web Vitals Study April 2021, only four percent of all studied websites are prepared for the update and have a good ranking in all three metrics. It’s good timing for companies to invest efforts for necessary improvements and easily stand out among other websites. Lastly, user expectations continue to rise higher standards, and Google has a responsibility to help users reach relevant searches. At the same time, Google pushes the digital community to prioritize UX because that helps to keep users on their websites. Google's study shows that visitors are 24% less likely to abandon the websites that meet proposed metrics thresholds.
Your brains are most likely filled with dopamine by thinking about possible UX improvements to your website. Let’s use that momentum and dig deeper into each metric of Core Web Vitals.
Core Web Vitals Metrics
Core Web Vitals is the subset of unified guidance for great UX indication called Web Vitals. Core metrics highlight the metrics that matter most. Metrics are not written in stone! They represent the best available indicators developers have today. Thus, be welcoming for future improvements or additions.
The current set of metrics is largest contentful paint (LCP), first input delay (FID), and cumulative layout shift (CLS).
Listed metrics of Web Vitals: mobile-friendly, safe browsing, HTTPS, no intrusive interstitials, loading, visual stability and interactivity. The last 3 ones are ascribed to Core Web Vitals.
Largest Contentful Paint
LCP measures the time to render the largest element in a currently viewed page part. The purpose is to measure how quickly the main content is ready to be used for the user. Discussions and research helped to understand that the main content is considered the largest element as an image or text block in a viewport. Exposed elements are
<img>
<image> inside an <svg> (Note: <svg> itself currently is not considered as a candidate)
<video>
an element with a background image loaded via the url()
block-level elements containing text nodes or other inline-level text elements children.
During the page load, the largest element in a viewport is detected as a candidate of LCP. It might change until the page is fully loaded. In example A below, the candidate changed three times since larger elements were found. Commonly, the LCP is the last loaded element, but that’s not always the case. In example B below, the paragraph of text is the largest element displayed before a page loads an image. Comparing the two, example B has a better LCP score than example A.
LCP detection in two examples: LCP is the last loaded element on a page (A), LCP occurs before the page is fully loaded (B).
Websites should meet 2.5 seconds or less LCP for getting a score that indicates good UX. But… Why 2.5? The inspiration was taken from studies by Stuart K. Card and Robert B. Miller, that found that a user will wait roughly 0.3 to 3 seconds before losing focus. In addition, gathered data about top-performing sites across the Web showed that such a limit is consistently achievable for well-optimized sites.
Good
Poor
LCP
<= 2.5s
> 4s
FID
<= 100ms
> 300ms
CLS
<= 0.1
> 0.25
The thresholds of “good” and “poor” Web Core Vitals scores. The scores in between are considered “needs improvement”.
First Input Delay
FID quantifies the user’s first impression of the responsiveness and interactivity of a page. To be precise, how long does a browser take to become available to respond to the first user’s interaction on a page. For instance, the time between when the user clicks on the “open modal” button and when the browser is ready to trigger the modal opening. You may wonder, shouldn’t the code be executed immediately after the user’s action? Not necessarily, during page load, the browser’s main thread is super busy parsing and executing loaded JavaScript (JS) files—incoming events might wait until processing.
FID represents the time between when a browser receives the first user’s interaction and can respond to that.
FID measures only the delay in event processing. Time to process the event and update UI afterwards were deliberately excluded to avoid workarounds like moving event processing logic to asynchronous callbacks. The workaround would improve such metric scores because it separates processing from the task associated with the event. Sadly, that wouldn’t bring any benefits for the user—likely the opposite.
User’s interactions require the main thread to be idle even when the event listener is not registered. For example, the main thread might delay the user’s interaction with the following HTML elements until it completes ongoing tasks:
text fields, checkboxes, and radio buttons (<input>, <textarea>)
select dropdowns (<select>)
links (<a>).
Jakob Nielsen described in the Usability Engineering book: “0.1 second is about the limit for having the user feel that the system is reacting instantaneously, meaning that no special feedback is necessary except to display the result”. Despite being first described in 1993, the same limit is considered good in Core Web Vitals nowadays.
Cumulative Layout Shift
CLS measures visual stability and counts how much the visible content shifts around. Layout shifts occur when existing elements change their start position defined by Layout Instability API. Note that when a new element is added to the DOM or an existing element changes size—it doesn’t count as a layout shift!
The metric is named “cumulative” because the score of each shift is summed. In June 2021, the duration of CLS was improved for long-lived pages (for example SPAs and infinite scroll apps) by grouping layout shifts and ensuring the score doesn’t grow unbounded.
Are all layout shifts bad? No. CLS focuses only on unexpected ones. Expected layout shifts occur within 500 milliseconds after user’s interactions (that is clicking on a link, typing in a search box, etc.). Such shifts are excluded from CLS score calculations. This knowledge may encourage creating extra space immediately after the user’s input with a loading state for tasks that take longer to complete.
Let’s use a tiny bit of math to calculate the layout shift score of the following example:
Impact fraction describes the amount of space an unstable element takes up of a viewport. When an element covers 60% of a viewport, its impact fraction is 0.6.
Distance fraction defines the amount of space that an unstable element moves from the original to the final position. When an element moves by 25% of a viewport height, its distance fraction is 0.25.
Having layout_shift_score = impact_fraction * distance_fraction formula, the layout shift score of this example is 0.6 * 0.25 = 0.15.
The example of 0.15 layout shift score in a mobile view.
A good CLS score is considered to be 0.1 or less for a page. Evaluated real-world pages revealed that the shifts of such good scores are still detectable but not excessively disruptive. Leaving shifts of 0.15 score and above consistently the opposite.
How to Measure the Score of My Web Page?
There are many different toolings to measure Core Web Vitals for a page. Tools reflect two main measurement techniques: in the lab or in the field.
In the Lab
Lab data, also known as synthetic data, is collected from a simulated environment without a user. Measures in such an environment can be tested before features are released in production. Be aware that FID can’t be measured in such a way! Lab data doesn’t contain the required real user input. As an alternative, it’s suggested to track its proxy—Total Blocking Time (TBT).
Tooling:
Lighthouse: I think it is the most comprehensive tool using lab data. It can be executed either on public or authenticated web pages. The generated report indicates the scores and suggests personalised opportunities to improve the performance. The best part is that Chrome users already have this tool ready to be used under DevTools. The drawback I noticed during using the tool—the screen of a page should be visible during the measurement process. Thus, the same browser doesn’t support the analysis of several pages in parallel. Lastly, Lighthouse can be incorporated into continuous integration workflows via Lighthouse CI.
WebPageTest: The tool can perform analyses for public pages. I was tricked by the tool when I provided a URL of the authenticated page for the first time. I got results. Better than I expected. Just before patting myself on the back, I decided to dig deeper into a waterfall view. The view showed clearly that the authenticated page wasn’t even reached and it was navigated to a public login page. Despite that, the tool has handy options to test against different locations, browsers, and device emulators. It might help to identify which country or state troubles the most and start thinking about Content Delivery Network (CDN). Finally, be aware that the report includes detailed analyses but doesn’t provide advice for improvements.
Web Vitals extension: It's the most concrete tool of all. It contains only metrics and scores for the currently viewed page. In addition, the tool shows how it calculates scores in real-time. For example, FID is shown as “disabled” until your interaction happens on a page.
In the Field
A site’s performance can vary dramatically based on a user’s personalized content, device capabilities, and network conditions. Real User Monitoring (RUM) captures the reality of page performance, including the mentioned differences. Monitoring data shows the performance experienced by a site’s actual users. On the other hand, there’s a way to check the real-world performance of a site without a RUM setup. Chrome User Experience Report gathers and aggregates UX metrics across the public web from opted-in users. Such findings power the following tools:
Chrome UX Report Compare Tool (CRUX): As the name dictates, the tool is meant for pages’ comparison. The report includes metrics and scores of selected devices’ groups: desktop, tablet, or mobile. It is a great option to compare your site with similar pages of your competitors.
PageSpeed Insights: The tool provides detailed analyzes for URLs that are known by Google’s web crawlers. In addition, it highlights the opportunities for improvements.
Search Console: The tool reports performance data per page, including historical data. Before using it—verification of ownership is mandatory.
Web Vitals extension: The tool was mentioned for lab toolings, but there’s one more feature to reveal. For pages in which field data is available via Chrome UX Report, lab data (named “local” in the extension) is combined with real-user data from the field. This integration might indicate how similar your individual experiences are to other website users.
CRUX based tools are great and quick starters for investigations. Despite that, your retrieved RUM data can provide more detailed and immediate feedback. To setup RUM for a website might look scary at the beginning, but usually, it takes these steps:
In order to send data from a website, a developer implements a RUM Javascript snippet to the source code.
Once the user interacts or leaves the website, the data about an experience is sent to a collector. This data is processed and stored in a database that anyone can view via convenient dashboards.
How to Improve
Core Web Vitals provides insights into what’s hurting the UX. For example, setting up RUM even for a few hours can reveal where the most significant pain points exist. The worst scoring metrics and pages can indicate where to start searching for improvements. Other toolings mentioned in the previous section might suggest how to fix the specific issues. The great thing is that all scores will likely increase by applying changes to improve one metric.
Many indications and bits of advice may sound like coins in the Super Mario game, which are hanging for you to grab. That isn’t the case. The hard and sweaty work remains on your table! Not all opportunities are straightforward to implement. Some might include big and long-lasting refactoring that can’t be done in one go or for which preparations should be completed. Thus, it adds several strategies to start explorations:
Update third-party libraries. After reviewing your application libraries, you might reveal that some are no longer used or lighter alternatives (covering the same use case) exist. Next, sometimes only a part of the included library is actually used. That leads to the situation where a portion of JS code is loaded without purpose at all. Tree-shaking could solve this issue. It enables loading only registered specific features from a library instead of loading everything. Be aware that not all libraries support tree-shaking yet, but it’s getting more and more popular. Updates of application dependencies may sound like a small help, but let’s lead by an example. During Shopify internal Hack Days, my team executed the mentioned updates for our dropshipping app Oberlo. It decreased the compressed bundle size of the application by 23%! How long did it take for research and development? Less than three days. This improves FID and LCP.
Preload critical assets. The loading process might be extended due to the late discovery of crucial page resources by the browser. By noting which resources can be fetched as soon as possible, the loading can be improved drastically. For example, Shopify noticed a 50% (1.2 seconds) improvement in time-to-text-paint by preloading Web Fonts. This improves FID and LCP.
Review your server response time. If you’re experiencing severe delays, you may try the following: a) use a dedicated server instead of a shared one for web hosting b) route the user to a nearby CDN c) cache static assets d) use service workers to reduce the amount of data users need to request from a server. This improves FID and LCP
Optimize heavy elements. Firstly, shorten the loading and rendering of critical resources by implementing the lazy-loading strategy. It defers the loading of large elements like images below the page viewport once it’s required for a user. Do not add lazy loading for elements in the initial viewport because the LCP element should be loaded as fast as possible! Secondly, compress images to have fewer bytes to download. Images don’t always require high quality or resolution and can be downgraded intentionally without affecting the user. Lastly, provide dimensions as width and height attributes or aspect-ratio boxes. It ensures that a browser can allocate the correct amount of space in the document while the image is loading to avoid unexpected layout shifts. This improves FID, LCP, and CLS.
To sum everything up, Google introduced Core Web Vitals to help us to improve the UX of websites. In this article, I’ve shared clarifications of each core metric, the motives of score thresholds, tools to measure the UX scores of your web pages, and strategies for improvements. Loading, interactivity, and visual stability are the metrics highlighted today. Future research and analyses might reveal different Core Web Vitals to focus on. Be prepared!
Meet the author of this article—Laura Silvanavičiūtė. Laura is a Web Developer who is making drop-shipping better for everyone together with the Oberlo app team. Laura loves Web technologies and is thrilled to share the most exciting parts with others via tech talks at conferences or articles on medium.com/@laurasilvanavi.
Wherever you are, your next journey starts here! If building systems from the ground up to solve real-world problems interests you, our Engineering blog has stories about other challenges we have encountered. Intrigued? Visit our Engineering career page to find out about our open positions and learn about Digital by Default.
I’ve built a benchmarking harness for YJIT and a big site of graphs and benchmarks, updated twice a day .
I’d love to tell you more about that. But before I do, I know you’re asking, How fast is YJIT? That’s why the top of our new public page of YJIT results looks like this:
Overall, YJIT is 20.6% faster than interpreted CRuby, or 17.4% faster than MJIT! On Railsbench specifically, YJIT is 18.5% faster than CRuby, 21.0% faster than MJIT!
After that, there are lots of graphs and, if you click through, giant tables of data. I love giant tables of data.
And I hate doing constant ops work. So let’s talk about a low effort way to make GitHub do all your operational work for a constantly-updated website, shall we?
I’ll talk benchmarks along the way, because I am still me.
By the way, I work on the YJIT team at Shopify. We’re building a Ruby optimizer to make Ruby faster for everybody. That means I’ll be writing about it. If you want to keep up, this blog has a subscribe thing (down below.) Fancy, right?
The Bare Necessities
I’ve built a few YJIT benchmarks. So have a lot of other folks. We grabbed some existing public benchmarks and custom-built others. The benchmarks are all open-source so please, have a look. If there’s a type of benchmark you wish we had, we take pull requests!
When I joined the YJIT team, that repo had a perfectly serviceable runner script that would run benchmarks and print the results to console (which still exists, but isn’t used as much anymore.) But I wanted to compare speed between different Ruby configurations and do more reporting. Also, where do all those reports get stored? That’s where my laziness kicked in.
GitHub Pages is a great way to have GitHub host your website for free. A custom Jekyll config is a great way to get full control of the HTML. Once we had results to post, I could just commit them to Git, push them, and let GitHub take care of the rest.
But Jekyll won’t keep it all up to date. That needs GitHub Actions. Between them, the final result is benchmarks run automatically, the site updates automatically, and it won’t email me unless something fails.
Perfect.
Want to see the gritty details?
Setting up Jekyll
GitHub Pages run on Jekyll. You can use something else, but then you have to run it on every commit. If you use Jekyll, GitHub runs it for you and tells you when things break. But you’d like to customise how Jekyll runs and test locally with bundle exec jekyll serve. So you need to set up _config.yml in a way that makes all that happen. GitHub has a pretty good setup guide for that. And here's _config.yml for speed.yjit.org.
Of course, customising the CSS is hard when it’s in a theme. You need to copy all the parts of the theme into your local repo, like I did, if you want to change how they work (like not supporting <b> for bold and requiring <strong>, I’m looking at you , Slate).
But once you have that set up, GitHub will happily build for you. And it’s easy! No problem! Nothing can go wrong!
Oh, uh, I should mention, maybe, hypothetically, there might be something you want to put in more than one place. Like, say, a graph that can go on the front page and on a details page, something like that. You might be interested to know that Jekyll requires anything you include to live under _includes or the current subdirectory, so you have to generate your graph in there. Jekyll makes it really hard to get around the has to be under _includes rule. And once you’ve put the file under _includes, if you want to put it onto a page with its own URL, you should probably research Jekyll collections. And an item in a collection gets one page, not one page per graph… Basically, your continuous reporting code, like mine, is going to need to know more about Jekyll than you might wish.
A snippet of Jekyll _config.yml that adds a collection of benchmark objects which should be output as individual pages
But once you’ve set Jekyll up, you can have it run the benchmarks, and then you have nice up-to-date data files. You’ll have to generate graphs and reports there too. You can pre-run jekyll build to see if everything looks good. And as a side benefit, since you’re going to need to give it GitHub credentials to check in its data files, you can have it tell you if the performance of any benchmark drops too much.
AWS and GitHub Actions, a Match Made In… Somewhere
Of course, if you’re benchmarking, you don’t want to run your benchmarks in GitHub Actions. You want to do it where you can control the performance of the machine it runs on. Like an AWS instance! Nothing could go wrong.
I just needed to set up some repo secrets for logging into the AWS instance. Like a private key, passed in an environment variable and put into an SSH identity file, that really has to end with a newline or everything breaks. But it’s fine. Nothing could go wrong!
Hey, did you know that SSH remembers the host SSH key from any previous time you SSH’d there? And that GitHub Actions uses a shared .known_hosts file for those keys? And AWS re-uses old public IP addresses? So there’s actually a pretty good chance GitHub Actions will refuse to SSH to your AWS instance unless you tell it -oStrictHostKeyChecking=no. Also, SSH doesn’t usually pass environment variables through, so you’re going to need to assign them on its command line.
So, I mean, okay, maybe something could go wrong.
If you want to SSH into an AWS instance from GitHub Actions, you may want to steal our code, is what I’m saying.
For the Love of Graphs
Of course, none of this gets you those lovely graphs. We all want graphs, right? How does that work? Any way you want, of course. But we did a couple of things you might want to look at.
A line graph of how four benchmarks’ results have changed over time, with ‘whiskers’ at each point to show the uncertainty of the measurement.
For the big performance over time graph on the front page, I generated a D3.js graph from Erb. If you’ve used Rails, generating HTML and JS from Ruby should sound pretty reasonable. I’ve had good luck with it for several different projects. D3 is great for auto-generating your X and Y axis, even on small graphs, and there’s lots of great example code out there.
If you want to embed your results, you can generate static SVGs from Ruby. That takes more code, and you’ll probably have more trouble with finicky bits like the X and Y axis or the legend. Embeddable graphs are hard in general since you can’t really use CSS and everything has to be styled inline, plus you don’t know the styling for the containing page. Avoid it if you can, frankly, or use an iframe to embed. But it’s nice that it’s an option.
A large bar graph of benchmark results with simpler axis markings and labels.
Both SVG approaches, D3 and raw SVG, allow you to do fun things with JavaScript like mouseover (we do that on speed.yjit.org) or hiding and showing benchmarks dynamically (like we do on the timeline deep-dive). I wouldn’t try that for embeddable graphs, since they need more JavaScript that may not run inside a random page. It’s more enjoyable to implement interesting features with D3 instead of raw SVG.
A blocky, larger-font bar graph generated using matplotlib.
Although it saddens my withered heart, reporting isn’t just generating pretty graphs and giant, imposing tables. You also need a certain amount of “English text” designed to be “read” by “human beings.”
That big block up-top that says how fast YJIT is? It’s generated from an Erb template, of course. It’s a report, just like the graphs underneath it. In fact, even the way we watch if the results drop is calculated from two JSON files that are both generated as reports—each tripwire report is just a list of how fast every benchmark was at a specific time, and an issue gets filed automatically if any of them drop too fast.
So What’s the Upshot?
There’s a lot of text up there. Here’s what I hope you take away:
GitHub Actions and GitHub Pages do a lot for you if you’re running a batch-updated dynamic site. There are a few weird subtleties, and it helps to copy somebody else’s code where you can.
YJIT is pretty fast. Watch this space for more YJIT content in the future. You can subscribe below.
Graphs are awesome. Obviously.
Noah Gibbs wrote the ebook Rebuilding Rails and then a lot about how fast Ruby is at various tasks. Despite being a grumpy old programmer in Inverness, Scotland, Noah believes that some day, somehow, there will be a second game as good as Stuart Smith’s Adventure Construction Set for the Apple IIe. Follow Noah on Twitter and GitHub.
Wherever you are, your next journey starts here! If building systems from the ground up to solve real-world problems interests you, our Engineering blog has stories about other challenges we have encountered. Intrigued? Visit our Engineering career page to find out about our open positions and learn about Digital by Default.
YJIT is a Just-In-Time Compiler, so it works by converting your most frequently used code into optimized native machine code. Early results are good—for instance, we’re speeding up a simple hello, world Rails benchmark by 20% or more. Even better, YJIT is pretty reliable: it runs without errors on Shopify’s full suite of unit tests for its main Rails application, and similar tests at GitHub. Matz, Ruby’s chief designer, mentioned us in his EuRuKo keynote. By the time you read this, YJIT should be merged into CRuby in time for Ruby 3.1 release at Christmas.
Maybe you’d like to take YJIT out for a spin. Or maybe you’re just curious about how to compile CRuby (a.k.a. plain Ruby or Matz’s Ruby Interpreter.) Or maybe you just like reading technical blog posts with code listings in them. Reading blog posts feels weirdly productive while you’re waiting for a big test run to finish, doesn’t it? Even if it’s not 100% on-topic for your job.
YJIT is available in the latest CRuby as 3.1.0-dev if you use ruby-build . But let’s say that you don’t or you want to configure YJIT with debugging options, statistics, or other customizations.
Since YJIT is now part of CRuby, it builds and installs the same way that CRuby does. So I’ll tell you how you build CRuby and then you’ll know all about building YJIT too. We’ll also talk about:
How mature YJIT is or isn’t
How stable is it
Is it ready for you to use at work
Will this speed turn into real-world benefits, or is it all benchmarks.
We’re building something new and writing about it. There’s an email subscription widget on this post found at the top-left and bottom. Subscribe and you’ll hear the latest, soonest.
Start Your Engines
If you’re going to build Ruby from source, you’ll need a few things. Autoconf, make, OpenSSL, and GCC or Clang. If you’re on a Mac, XCode and Homebrew will get you these things. I won’t go into full details here, but Google can help out.
brew install autoconf@2.69 openssl@1.1 # Unless you already have them
On Linux, you’ll need a package similar to Debian build-essential plus autoconf and libssl-dev. Again, Google can help you here if you include the name of your Linux distribution. These are all common packages. Note that installing only Ruby from a package isn’t enough to build a new Ruby. You’re going to need Autoconf and a development package for OpenSSL. These are things a pre-built Ruby package doesn’t have.
Now that you have the prerequisites installed, you clone the repo and build:
And that will build you a local YJIT-enabled Ruby. If you’re using chruby, you can now log out, log back in, and switch to it with chruby ruby-yjit. rbenv is similar. With rvm you’ll need to mount it explicitly with a command like rvm mount ~/.rubies/ruby-yjit/bin/ruby -n ruby-yjit and then switch to it with rvm use ext-ruby-yjit.
Note: on Mac, we’ve had a report of Autoconf 2.71 not working with Ruby. So you may need to install version 2.69, as shown above. And for Ruby in general you’ll want OpenSSL 1.1 - Ruby doesn’t work with version 3, which Homebrew installs by default.
How Do I Know if YJIT Is Installed?
Okay… So YJIT runs the same Ruby code, but faster. How do I know I even installed it?
First, and simplest, you can ask Ruby. Just run ruby --enable-yjit -v. You should see a message underneath that YJIT is enabled. If you get a warning that enable-yjit isn’t a thing, you’re probably using a different Ruby than you think. Check that you’ve switched to it with your Ruby version manager.
This message means this Ruby has no YJIT.
You can also pop into irb and see if the YJIT module exists:
You may want to export RUBYOPT=’--enable-yjit’ for this, or export RUBY_YJIT_ENABLE=1 which also enables YJIT. YJIT isn’t on by default, so you’ll need to enable it.
Running YJIT
After you’ve confirmed YJIT is installed, run it on some code. We found it runs fine on our full unit test suites, and a friendly GitHubber verified that it runs without error on theirs. So it’ll probably handle yours without a problem. If you pop into your project of choice and run rake test with YJIT and without, you can compare the times.
If you can’t think of any code to run it on, YJIT has a benchmark suite we like. You could totally use it for that. If you do, you can run things like ruby -Iharness benchmarks/activerecord/benchmark.rb and compare the times. Those are the same benchmarks we use for speed.yjit.org . You may want to read YJIT’s documentation while you’re there. There are some command-line parameters and build-time configurations that do useful and fun things.
Is YJIT Ready for Production?
Benchmarks are fine, but YJIT doesn’t always deliver the same real-world speedups. We’ve had some luck on benchmarks and minor speedups with production code, but we’re still very much in-progress. So where is YJIT actually at?
First, we’ve had good luck running it on our unit tests, our production-app benchmarking code, and one real web app here at Shopify. We get a little bit of speedup, in the neighbourhood of 6%. That can add up when you multiply by the number of servers Shopify runs… But we aren’t doing it everywhere, just on a small percentage of traffic for a real web service, basically a canary deployment.
Unit tests, benchmarks and a little real traffic is a good start. We’re hoping that early adopters and being included in Ruby 3.1 will give us a lot more real world usage data. If you try YJIT, we’d love to hear from you. File a GitHub issue, good or bad, and let us know!
Hey, YJIT Crashed! Who Do I Talk to?
Awesome! I’ve been fuzz-testing YJIT with AFL for days and trying to crash it. If you could file an issue and tell us as much as possible about how it broke, we’d really appreciate that. Similarly, anything you can tell us about how fast it is or isn’t is much appreciated. This is still early days.
And if YJIT is really slow or gives weird error messages, that’s another great reason to file an issue. If you run your code with YJIT, we’d love to hear what breaks. We’d also love to hear if it speeds you up! You can file an issue and, even if it’s good not bad, I promise we’ll figure out what to do with it.
What if I Want More?
Running faster is okay. But maybe you find runtime_stats up above intriguing. If you compile YJIT with CFLAGS=’-DRUBY_DEBUG=1’ or CFLAGS=’-DYJIT_STATS=1’ you can get a lot more detail about what it’s doing. Make sure to run it with YJIT_STATS set as an environment variable or yjit-stats on the command line. And then YJIT.runtime_stats will have hundreds of entries, not just two.
When you run with statistics enabled, you’ll also get a report printed when Ruby exits showing interesting things like:
what percentage of instructions were run by YJIT instead of the regular interpreter
how big the generated code was
how many ISEQs (methods, very roughly) were compiled by YJIT.
The beginning of a YJIT statistics exit report for a trivial one-line print command.
What Can I Do Next?
Right now, it’s really helpful just to have somebody using YJIT at all. If you try it out and let us know what you find, that’s huge! Other than that, just keep watching. Check the benchmarks results now and then. Maybe talk about YJIT a little online to your friends. As a famous copyrighted movie character said, "The new needs friends." We’ll all keep trying to be friendly.
Noah Gibbs wrote the ebook Rebuilding Rails and then a lot about how fast Ruby is at various tasks. Despite being a grumpy old programmer in Inverness, Scotland, Noah believes that some day, somehow, there will be a second game as good as Stuart Smith’s Adventure Construction Set for the Apple IIe. Follow Noah on Twitter and GitHub.
Wherever you are, your next journey starts here! If building systems from the ground up to solve real-world problems interests you, our Engineering blog has stories about other challenges we have encountered. Intrigued? Visit our Engineering career page to find out about our open positions and learn about Digital by Default.
The 1980s and 1990s saw the genesis of Perl, Ruby, Python, PHP, and JavaScript: interpreted, dynamically-typed programming languages which favored ease of use and flexibility over performance. In many ways, these programming languages are a product of the surrounding context. The 90s were the peak of the dot-com hype, and CPU clock speeds were still doubling roughly every 18 months. It looked like the growth was never going to end. You didn’t really have to try to make your software run fast because computers were just going to get faster, and the problem would take care of itself. Today, things are a bit different. We’re reaching the limit of current silicon fabrication technologies, and we can’t rely on single-core performance increases to solve our performance problems. Because of mobile devices and environmental concerns, we’re beginning to realize that energy efficiency matters.
Last year, during the pandemic, I took a job at Shopify, a company that runs a massive server infrastructure powered by Ruby on Rails. I joined a team with multiple software engineers working on improving the performance of Ruby code in a variety of ways, ranging from optimizing the CRuby interpreter and its garbage collector to the implementation of TruffleRuby, an alternative Ruby implementation. Since then, I’ve been working with a team of skilled engineers from Shopify and GitHub on YJIT, a new Just-in-time (JIT) compiler built inside CRuby.
This project is important to Shopify and Ruby developers worldwide because speed is an underrated feature. There’s already a JIT compiler inside CRuby, known as MJIT, which has been in the works for three years. And while it has delivered speedups on smaller benchmarks, so far, it’s been less successful at delivering real-world speedups on widely used Ruby applications such as Ruby on Rails. With YJIT, we take a data-driven approach and focus specifically on performance hotspots of larger applications such as Rails and Shopify Core (Shopify’s main Rails monolith).
What’s YJIT?
Tobi Lütke tweeting about YJIT
YJIT is a project to gradually build a JIT compiler inside CRuby such that more and more of the code is executed by the JIT, which will eventually replace the interpreter for most of the execution. The compiler, which is soon to become officially part of CRuby, is based on Basic Block Versioning (BBV), a JIT compiler architecture I started developing during my PhD. I’ve given talks about YJIT this year at the MoreVMs 2021 workshop and another one at RubyKaigi 2021 if you’re curious to hear more about the approach we’re taking.
Current Results
We’re about one year into the YJIT project at this point, and so far, we’re pleased with the results, which have significantly improved since the MoreVMs talk. According to our set of benchmarks, we’ve achieved speedups over the CRuby interpreter of 20% on railsbench, 39% on liquid template rendering, and 37% on activerecord. YJIT also delivers very fast warm up. It reaches near-peak performance after a single iteration of any benchmark and performs at least as well as the interpreter on every benchmark, even on the first iteration.
Benchmark speed (iterations/second) scaled to the interpreter’s performance (higher is better)
Building YJIT inside CRuby comes with some limitations. It means that our JIT compiler has to be written in C and that we have to work with design decisions in the CRuby codebase that weren’t made with a high-performance JIT compiler in mind. However, it has the key advantage that YJIT is able to maintain almost 100% compatibility with existing Ruby code and packages. We pass the CRuby test suite, comprising about 30,000 tests, and we have also been able to pass all of the tests of the Shopify Core CI, a codebase that contains over three million lines of code and depends (directly and indirectly) on over 500 Ruby gems, as well as all the tests in the CI for GitHub’s backend. We also have a working deployment to a small percentage of production servers at Shopify.
We believe that the BBV architecture that powers YJIT offers some key advantages when compiling dynamically-typed code. Having end-to-end control over the full code generation pipeline will allow us to go farther than what’s possible with the current architecture of MJIT, which is based on GCC. Notably, YJIT can quickly specialize code based on type information and patch code at run time based on the run-time behavior of programs. The advantage in terms of compilation speed and warmup time is also difficult to match.
Next Steps
The Ruby core developers have invited the YJIT team to merge the compiler into Ruby 3.1. It’s a great honor for my colleagues and myself to have our work become officially part of Ruby. This means, in a few months, every Ruby developer will have the opportunity to try YJIT by simply passing a command-line option to the Ruby binary. However, our journey doesn’t stop there, and we already have plans in the works to make YJIT and CRuby even faster.
Currently, only about 79% of instructions in railsbench are executed by YJIT, and the rest run in the interpreter, meaning that there’s still a lot we can do to improve upon our current results. There’s a clear path forward, and we believe YJIT can deliver much better performance than it does now. However, as part of building YJIT, we’ve had to dig through the implementation of CRuby to understand it in detail. In doing so, we’ve identified a few key elements in its architecture that we believe can be improved to unlock higher performance. These improvements won’t just help YJIT, they’ll help MJIT too, and some of them will even make the interpreter faster. As such, we will likely try to upstream some of this work separately from YJIT.
I may expand on some of these in future blog posts, but here is a tentative list of potential improvements to CRuby that we would like to tackle:
Moving CRuby to an object model based on object shapes.
Changing the CRuby type tagging scheme to reduce the cost of type checks.
Implementing a more fine-grained constant caching mechanism.
A faster, more lightweight calling convention.
Rewriting C runtime methods in Ruby so that JIT compilers can inline through them.
Matz (Yukihiro Matsumoto) has stated in his recent talk at Euruko 2021 that Ruby would remain conservative with language additions in the near future. We believe this is a wise decision as rapid language changes can make it difficult for JIT implementations to get off the ground and stay up to date. It makes some sense, in our opinion, for Ruby to focus on internal changes that will make the language more robust and deliver very competitive performance in the future.
I hope you’re as excited about the future of YJIT and Ruby as we are. If you’re interested in trying YJIT, it’s available on GitHub under the same open source license as CRuby. If you run into bugs, we’d appreciate it if you would open an issue and help us find a simple reproduction. Stay tuned as two additional blog posts about YJIT are coming soon, with details about how you can try YJIT, and the performance tracking system we’ve built for speed.yjit.org.
Maxime Chevalier-Boisvert obtained a PhD in compiler design at the University of Montreal in 2016, where she developed Basic Block Versioning (BBV), a JIT compiler architecture optimized for dynamically-typed programming languages. She is currently leading a project at Shopify to build YJIT, a new JIT compiler built inside CRuby.
Wherever you are, your next journey starts here! If building systems from the ground up to solve real-world problems interests you, our Engineering blog has stories about other challenges we have encountered. Intrigued? Visit our Engineering career page to find out about our open positions and learn about Digital by Default.
Sometimes as a software developer you come across a seemingly innocuous piece of code that, when investigated, leads you down a rabbit hole much deeper than you anticipated. This is the story of such a case.
It begins with some clever Ruby code that we want to refactor, and ends with a prototype solution that changes the language itself. Along the way, we unearth a performance issue in TruffleRuby, an implementation of the Ruby language, and with it, an opportunity to work at the compiler level to even off the performance cliff. I’ll share this story with you.
A Clever Way to Fetch Values from a Nested Hash
The story begins with some Ruby code that struck me as a little bit odd. This was production code seemingly designed to extract a value from a nested hash, though it wasn’t immediately clear to me how it worked. I’ve changed names and values, but this is functionally equivalent to the code I found:
Two things specifically stood out to me. Firstly, when extracting the value from the data hash, we’re calling the same method, fetch, twice and chaining the two calls together. Secondly, each time we call fetch, we provide two arguments, though it isn’t immediately clear what the second argument is for. Could there be an opportunity to refactor this code into something more readable?
Before I start thinking about refactoring, I have to make sure I understand what’s actually going on here. Let’s do a quick refresher on fetch.
About Fetch
The Hash#fetch method is used to retrieve a value from a hash by a given key. It behaves similarly to the more commonly used [ ] syntax, which is itself a method and also fetches values from a hash by a given key. Here’s a simple example of both in action.
Like we saw in the production code that sparked our investigation initially, you can chain calls to fetch together like you would using [ ], to fetch nested values to extract a value from nested key-value pairs.
Now, this works nicely assuming that each chained call to fetch returns a hash itself. But what if it doesn’t? Well, fetch will raise a KeyError.
This is where our optional second argument comes in. Fetch accepts an optional second argument that serves as a default value if a given key can’t be found. If you provide this argument, you get it back instead of the key error being raised.
Helpfully, you can also pass a block to make the default value more dynamic.
Let’s loop back around to the original code and look at it again now that we’ve had a quick refresher on fetch.
The Refactoring Opportunity
Now, it makes a little more sense as to what’s going on in the original code we were looking at. Here it is again to remind you:
The first call to fetch is using the optional default argument in an interesting way. If our data hash doesn’t have a response key, instead of raising a KeyError, it returns an empty hash. In this scenario, by the time we’re calling fetch the second time, we’re actually calling it against an empty hash.
Since an empty hash has no key-value pairs, this means when we evaluate the second call to fetch, we always get the default value returned to us. In this case, it’s an instance of IdentityObject.
While a clever workaround, I feel this could look a lot cleaner. What if we reduced a chained fetch into a single call to fetch, like below?
Well, there’s a precedent for this, actually, in the form of the Hash#dig method. Could we refactor the code using dig? Let’s do a quick refresher on this method before we try.
About Dig
Dig acts similarly to the [ ] and fetch methods. It’s a method on Ruby hashes that allows for the traversing of a hash to access nested values. Like [ ], it returns nil when it encounters a missing key. Here’s an example of how it works.
Now, if we try to refactor our initial code with dig, we can already make it look a lot cleaner and more readable.
Nice. With the refactor complete, I’m thinking, mission accomplished. But...
Versatile Fetch
One thing continues to bother me. dig just doesn’t feel as versatile as fetch does. With fetch you can choose between raising an error when a key isn’t found, returning nil, or returning a default in a more readable and user-friendly way.
Let me show you what I mean with an example.
Fetch is able to handle multiple control flow scenarios handily. With dig, this is more difficult because you’d have to raise a KeyError explicitly to achieve the same behaviour. In fact, you’d also have to add logic to make a determination about whether the key doesn’t exist or has an explicitly set value of nil, something that fetch handles much better.
So, what if Ruby hashes had a method that combined the flexibility of fetch with the ability to traverse nested hashes like dig is able to do? If we could do that, we could potentially refactor our code to the following:
Of course, if we want to add this functionality, we have a few options. The simplest one is to monkey patch the existing implementation of Ruby#Hash and add our new method to it. This lets me test out the logic with minimal setup required.
There’s also another option. We can try to add this new functionality to the implementation of the Ruby language itself. Since I’ve never made a language level change before, and because it seems more fun to go with option two, I decided to see how hard such a change might actually be.
Adding a New Method to Ruby Hashes
Making a language level change seems like a fun challenge, but it’s a bit daunting. Most of the standard implementation of the Ruby language is written using C. Working in C isn’t something I have experience with, and I know enough to know the learning curve would be steep.
So, is there an option that lets us avoid having to dive into writing or changing C code, but still allows us to make a language level change? Maybe there’s a different implementation of Ruby we could use that doesn’t use C?
Enter TruffleRuby.
TruffleRuby is an alternative implementation of the Ruby programming language built for GraalVM. It uses the Truffle language implementation framework and the GraalVM compiler. One of the main aims of the TruffleRuby language implementation is to run idiomatic Ruby code faster. Currently it isn’t widely used in the Ruby community. Most Ruby apps use MRI or other popular alternatives like JRuby or Rubinius.
However, the big advantage is that parts of the language are themselves written in Ruby, making working with TruffleRuby much more accessible for folks who are proficient in the language already.
After getting set up with TruffleRuby locally (you can do the same using the contributor guide), I jumped into trying to make the change.
Implementing Hash#dig_fetch in TruffleRuby
The easiest way to prototype our new behaviour is to add a brand new method on Ruby hashes in TruffleRuby. Let’s start with the very simple happy case, fetching a single value from a given hash. We’ll call our method dig_fetch, at least for our prototype.
Here’s how it works.
Let’s add a little more functionality. We’ll keep in line with fetch and make this method raise a KeyError if the current key isn’t found. For now, we just format the KeyError the same way that the fetch method has done it.
You may have noticed that there’s still a problem here. With this implementation, we won’t be able to handle the scenario where keys are explicitly set to nil, as they raise a KeyError as well. Thankfully, TruffleRuby has a way to deal with this that’s showcased in its implementation of fetch.
Below is how the body of the fetch method starts in TruffleRuby. You see that it uses a module called Primitive, which exposes the methods hash_get_or_undefined and undefined?. For the purposes of this post we won’t need to go into detail about how this module works, just know that these methods will allow us to distinguish between explicit nil values and keys that are missing from the hash. We can use this same strategy in dig_fetch to get around our problem of keys existing but containing nil values.
Now, when we update our dig_fetch method, it looks like this:
And here is our updated dig_fetch in action.
Finally, let’s add the ability to ‘dig’ into the hash. We take inspiration from the existing implementation of dig and write this as a recursive call to our dig_fetch method.
Here’s the behaviour in action:
From here, it’s fairly easy to add the logic for accepting a default. For now, we just use blocks to provide our default values.
And tada, it works!
So far, making this change has gone smoothly. But in the back of my mind, I’ve been thinking that any language level change would have to be justified with performance data. Instead of just making sure our solution works, we should make sure it works well. Does our new method hold up, performance-wise, to the other methods which extract values from a hash?
Benchmarking—A Performance Cliff Is Found
I figure it makes sense to test the performance of all three methods that we’ve been focusing on, namely, dig, fetch, and dig_fetch. To run our benchmarks, I’m using a popular Ruby library called benchmark-ips. As for the tests themselves, let’s keep them really simple.
For each method, let's look at two things
How many iterations it can complete in x seconds. Let’s say x = 5.
How the depth of the provided hash might impact the performance. Let’s test hashes with three, six, and nine nested keys.
This example shows how the tests are set up if we were testing all three methods to a depth of three keys.
Ok, let’s get testing.
Running the Benchmark Tests
We start by running the tests against hashes with a depth of three and it looks pretty good. Our new dig_fetch method performs very similarly to the other methods, knocking out about 458.69M iterations every five seconds.
But uh-oh. When we double the depth to six (as seen below) we already see a big problem emerging. Our method's performance degraded severely. Interestingly, dig degraded in a very similar way. We used this method for inspiration in implementing our recursive solution, and it may have unearthed a problem with both methods.
Let’s try running these tests on a hash with a depth of nine. At this depth, things have gotten even worse for our new method and for dig. We are now only seeing about 12.7M iterations every five seconds, whereas fetch is still able to clock about 164M.
When we plot the results on a graph, you see how much more performant fetch is over dig and dig_fetch.
So, what is going on here?
Is Recursion the Problem?
Let’s look at dig, the implementation of which inspired our dig_fetch method, to see if we can find a reason for this performance degradation. Here’s what it looks like, roughly.
The thing that really jumps out is that both dig and dig_fetch are implemented recursively. In fact, we used the implementation of dig to inspire our implementation of dig_fetch so we could achieve the same hash traversing behaviour.
Could recursion be the cause of our issues?
Well, it could be. An optimizing implementation of Ruby such as TruffleRuby attempts to combine recursive calls into a single body of optimized machine code, but there’s a limit to inlining—we can’t inline forever producing infinite code. By contrast, an iterative solution with a loop starts with the code within a single body of optimized machine code in the first place.
It seems we’ve uncovered an opportunity to fix the production implementation of dig in TruffleRuby. Can we do it by reimplementing dig with an iterative approach?
Shipping an Iterative Approach to #dig
Ok, so we know we want to optimize dig to be iterative and then run the benchmark tests again to test out our theory. I’m still fairly new to TruffleRuby at this point, and because this performance issue is impacting production code, it’s time to inform the TruffleRuby team of the issue. Chris Seaton, founder and maintainer of the language implementation is available to ship a fix for dig’s performance degradation problem. But first, we need to fix the problem.
So, let’s look at dig again.
To simplify things, let’s implement the iterative logic in a new package in TruffleRuby we will call Diggable. To be totally transparent, there’s a good reason for this, though one that we’ve glossed over in this post—dig is also available on Arrays and Structs in Ruby. By pulling out the iterative implementation into a shared package, we can easily update Array#dig, and Struct#dig to share the same behaviour later on. For now though, we focus on the Hash implementation.
Inside Diggable, we make a method called dig and add a loop that iterates as many times as the number of keys that were passed to dig initially.
With this change, dig continues to work as expected and the refactor is complete.
#dig Performance Revisited
Now, let’s have a look at performance again. Things look much better for dig with this new approach.
Our solution had a big impact on the performance of dig. Previously, dig could only complete ~2.5M iterations per second against a hash with nine nested keys, but after our changes it has improved to ~16M. You can see these results plotted below.
Awesome! And we actually ship these changes to see a positive performance impact in TruffleRuby. See Chris’ real PRs #2300 and #2301.
Now that that’s out of the way, it’s time to apply the same process to our dig_fetch method and see if we get the same results.
Back to Our Implementation
Now that we’ve seen the performance of dig improve we return to our implementation and make some improvements. Let’s add to the same Diggable package we created when updating dig.
The iterative implementation ends up being really similar to what we saw with dig.
After our changes we confirm that dig_fetch works. Now we can return to our benchmark tests and see whether our iterative approach has paid off again.
Benchmarking, Again
Performance is looking a lot better! dig_fetch is now performing similarly to dig.
Below you can see the impact of the changes on performance more easily by comparing the iterative and recursive approaches. Our newly implemented iterative approach is much more performant than the existing recursive one, managing to execute ~15.5M times per second for a hash with nine nested keys when it only hit ~2.5M before.
Refactoring the Initial Code
At this point, we’ve come full circle and can finally swap in our proposed change that set us down this path in the first place.
One more reminder of what our original code looked like.
And after swapping in our new method, things look much more readable. Our experimental refactor is complete!
Final Thoughts
Of course, even though we managed to refactor the code we found using dig_fetch, we cannot actually change the original production code that inspired this post to use it just yet. That’s because the work captured here doesn’t quite get us to the finish line -- we ignored the interoperability of dig and fetch with two other data structures, Arrays and Structs. On top of that, if we actually wanted to add the method to TruffleRuby, we’d also want to make the same change to the standard implementation, MRI, and we would have to convince the Ruby community to adopt the change.
That said, I’m happy with the results of this little investigation. Even though we didn’t add our dig_fetch method to the language for everyone to use, our investigation did result in real changes to TruffleRuby in the form of drastically improving the performance of the existing dig method. A little curiosity took us a long way.
Thanks for reading!
Julie Antunovic is a Development Manager at Shopify. She leads the App Extensions team and has been with Shopify since 2018.
In Part 2 of Understanding GraphQL for Beginners, we created queries that fetched us data. In Part 3, we learn what are mutations and create mutation queries to modify data. Before we begin, let’s recap what we learned so far in this series:
GraphQL is a data manipulation and query language for APIs.
There’s no more over and under fetching of data.
Root fields define the structure of your response fields based on the object fields selected. They’re the entry points (similar to endpoints) to your GraphQL server.
Object fields are attributes of an object.
Learning Outcomes
Create a GraphQL mutation to modify data in the database.
Use a GraphQL mutation to create a new ActiveRecord.
Modify data using a GraphQL mutation.
Use a GraphQL mutation to destroy an existing ActiveRecord.
Mutations are queries that create, modify, or delete objects in your database, similar to a PUT, POST, or DELETE request in REST. Mutation requests are sent to the same endpoint as query requests. Mutation queries have the following structure:
The query starts with mutation.
Any required arguments are under input.
The mutation field name contains the action it’s trying to perform, that is foodCreate.
We’re naming our mutation query with an object first, followed by the action. This is useful to order the mutations alphabetically, as seen below.
Ordered by object first
Ordered by action first
food_create.rb
create_food.rb
food_delete.rb
create_nutrition.rb
fiid_update.rb
delete_food.rb
nutrition_create.rb
delete_nutrition.rb
nutrition_delete.rb
update_food.rb
nutrition_update.rb
update_nutrition.rb
Left: Naming a mutation with an object first, followed by the action. Right: Naming a mutation with the action first, followed by an object.
There’s no preference with which naming convention you go with, but, we’re using the naming convention used on the left side of the image. You can find all mutations under the mutations directory and mutation_type.rb under the types directory.
Creating Your First Mutation Query
We create a foodCreate mutation to create new food items. To create a mutation query, enter the following in your terminal: rails g graphql:mutation foodCreate
The rails generator does the following things:
Check if a new mutation file like base_mutation.rb and mutation_type.rb exists. If it doesn’t, create them.
Add the root field, food_create to mutation_type.rb.
Create a class called food_create.rb.
Let’s go to the mutation_type.rb class and remove the field and method called test_field.
Notice how we don’t need to write a method here like in query_type.rb. The mutation: Mutations::foodCreate executes a method called resolve in that mutation class. We’ll learn what the resolve method is soon. We then go to food_create.rb and your class looks like this:
The first thing we’re going to do is add input arguments. Remove all the comments, then add the following:
GraphQL uses camel case ( placeOfOrigin) by default. To be consistent with Shopify’s style guide, we’ll use a snake case (place_of_origin) instead. The field’s snake case is converted to camel case by GraphQL automatically!
Next, we need to add in a resolve method. The resolve method fetches the data for its field (food_create from mutation_type.rb) and returns a response back. GraphQL server only has one resolve method per field in its schema.
You might be wondering what ** is. It’s an operator called a double splat and it passes in a hash to the resolve method. This allows us to pass in as many arguments as we like. For best practices, if there are more than three parameters, use a double splat to pass in the parameters. For the sake of simplicity, we use the double splat for the three arguments.
We then add in type Types::FoodCreate to indicate our response fields, and inside the resolve method, create a new ActiveRecord.
Now, let’s go test it out on GraphiQL! Go to http://localhost:3000/graphiql to test out our new mutation query!
Write the following query:
When you execute the query, you get the following response.
Creating the Mutation to Update an Existing Food Item
Create a new mutation called foodUpdate using rails g graphql:mutation foodUpdate. Inside the food_update class, we need to add in the arguments to update. ID will be part of the arguments.
The only required argument here is ID. We need to use an ID to look for an existing product. This allows the resolve method to find the food item and update it.
Next, we write the resolve method and response back.
Let’s test this new mutation query out. We rename our new food item from Apple Pie to Pumpkin Pie.
Try It Yourself #2
Create a mutation called nutritionUpdate to update an existing Nutrition ActiveRecord.
Creating the Mutation to Delete an Existing Food Item
Create a new mutation called foodDelete using rails g graphql:mutation foodDelete. The only argument needed in food_delete.rb is ID.
Next, we need to add the return type and the resolve method. For simplicity, we just use Types::FoodType as the response.
Let’s test this mutation in GraphiQL.
Try It Yourself #3
Create a mutation called nutritionDelete to delete an existing Nutrition ActiveRecord. Similar to foodDelete, we use Types::NutritionType as the response.
We’ve reached the end of this tutorial, I hope you enjoyed creating mutations to modify, create or delete data.
Let’s recap what we learned!
Mutations are queries that create, modify, or delete objects in your database.
To generate a mutation, we use rails g graphql:mutation nameAction.
A resolve method fetches the data for its field (food_create from mutation_type.rb) and returns a response back.
GraphQL server only has one resolve method per field in its schema.
GraphQL is a powerful data manipulation and query language for APIs that offers lots of flexibility. At times, it can seem very daunting to implement GraphQL to your application. I hope the Understanding GraphQL for Beginners series helps you to implement GraphQL into your personal projects or convince your work to adopt the GraphQL ecosystem.
If you would like to see the finished code for part three, check out the branch called part-3-solution.
Often mistaken as an intern Raymond Chung is building a new generation of software developers through Shopify’s Dev Degree program. As a Technical Educator, his passion for computer science and education allows him to create bite-sized content that engages interns throughout their day-to-day. When he is not teaching, you’ll find Raymond exploring for the best bubble tea shop.
We were a team of six people from three different teams with half of us completely new to the Shipping domain and some of us new to the company. We had six weeks to complete one ambitious project. Most of us had never met in person, let alone worked together. We worked like any other team: picked items off the backlog and worked on them. Everyone said they were open to pairing but very few paired, or if they paired it was with the one person they knew very well. Pull requests (PRs) came in but feedback was scarce. Everyone was new to each other and the domain, so opinions were rare, and when present, weak. PRs had a couple of nits, but otherwise they'd just go through. We may have been shipping, but growing, connecting, and learning, but were unsure.
Until one day, our teammate, Sheldon Nunes, introduced us to mob programming. Mob programming builds on pair programming but instead of two people pairing, it's an entire mob—more than two people—pairing on the same problem.
What is Mob Programming?
It started innocently enough, as none of us had done mob programming before. Six of us joined a video call and the driver shared their screen. It was ineffective. It wasn’t inclusive or engaging and ended up as pair programming with observers. We had 30 minutes of two individuals contributing, and everyone else had zoned out. Until someone asked, "How do we make sure that everyone doesn't fall asleep?!" Surely enough, mobbing has a solution for that: fast rotations of the driver.
Sheldon, our mob programming expert, suggested we switch to a 10-minute rotation of one driver. At the end of every rotation, the driver pushes the changes, and the next person pulls the changes and takes over. It worked like magic. By taking turns and having a short duration, everyone was forced into engagement or they would be lost on their turn. We made programming a game.
A mob of five people rotating every 10 minutes is 50 minutes of work per rotation. Though the 10 minutes passed quickly, we also moved swiftly and kept tight alignment. The fast rotation also meant that we made decisions quickly—nobody wanted a turn to end without having shipped anything—and every decision was reversible, so it hardly made sense not to be decisive. We saw the same with how much context one shared with the group. There was no risk of a 30-minute context dump by one individual who had high context because the short rotation forced people to share just enough context to get something done. Code reviews also became moot—everyone wrote the code together, so there was little back and forth, allowing us to ship even faster.
The most valuable benefits we saw with mob programming was the strength of our relationships after we started doing them. It was so effective, we noticed it immediately following the first session. Feedback was easier to give and receive because it wasn't a judgement but a collaboration. While collaborating so closely, we were able to learn from watching each other's unique workflows, laugh at each other’s scribbles and animal drawings, and engage in spontaneous games of tic tac toe.
The Five Lessons of Mob Programming
For Three months, the team performed mob programming almost daily. That intensive experience taught us a few things.
1. Pointing and Communicating
Being able to point with a crudely drawn arrow is important. Drawing increases the ways you can interact, changing from verbal only to verbal and visual, but most importantly, it keeps everyone engaged. When mobbing, a 30 second build feels like eternity - and being able to doodle or even see someone else draw doodles on the screen changes the engagement level of the group.
We tried one session without drawing and while it can work, it is an exercise of frustration as you try to explain to the driver exactly where to scroll, which character on a line the bracket is missing, and where exactly the spelling error is.
2. Discoverability Matters
Our first mobbing session came out of an informal coffee chat. We used Slack's /call feature for pairing so members of the team who weren't in the informal coffee chat could join at a later time. We started this in a private group with a direct message, but faced challenges such as not being able to add any "guests" who may have had the context on what we're trying to solve who we wanted to add to our mob. A call in a small private group also puts pressure on the whole team to join, irrespective of their availability. So we moved it to a public channel.
A mob that’s discoverable, so people can drop in and drop out, ensures that the mob doesn't "die off" and people can take a break. For us, this means using Slack huddles with screen share and Slack /call in a public channel. Give it a fun name or an obvious name, but keep it public.
3. The Right Problem in the Right Environment
A mob that’s rotating the driver constantly, like ours, requires a problem where people can set up the environment quickly. Have one branch and a simple setup. A single rotation should involve:
git pull
<mob>
git commit
-a -m 'WIP!!!"
git push
Yes, the good commit messages get ditched here. It's very possible to end your rotation with debugging statements in code. That's OK. Add a good commit message when a task is complete, not necessarily at every push. This reduces how long a hand off takes and allows rotations to happen without waiting for a "clean exit."
Writing tests (or even this article!) is a poor experience for mobbing. For tests, the runtime for tests is too long to be effective for a mob. These tasks are better in a pairing environment or solo activities, so often someone would volunteer for ownership of the task to take it to completion. For documentation, it's pretty hard to write a sentence together.
4. Invite Other Disciplines
The nature of mob programming means that non-developers can mob with developers. Sometimes it’s Directors who rarely get to code in their day to day or a Product Manager who’s curious. The point is that anyone can mob because the mob is available to help. The driver is expected to not know what to do, and by making that the default experience, mobbing becomes welcoming for developers of all skill levels.
5. Take a Break
Time passes fast in a mob. We found two hours is the maximum length. Mobbing sessions can drain the introverts in the team. Timebox it and set a limit to minimize the feeling of "missing out" for members of the team who are not able to participate.
Remote work changed for all of us permanently that day. Gone were the days of lamenting over the loss of learning through osmosis. In person, we learned from each other by overhearing conversations, but with remote work that quickly went away as conversations moved into private messages or meetings—unless you asked the question, you didn't get to hear the answer. There was no learning new shortcuts and tricks from your coworkers by happening to walk by. However, with mobbing, all of that was back. Arguably pairing should've done this too, but the key with mobbing is that you don't have to ask the questions or give the answers—you can learn from the conversations of others.
Before we were suffering from isolation and feeling disconnected from the team, now we were over-socialized and had to introduce no-pairing days to give people a chance to recharge. We’re now able to onboard newcomers as mob programming welcomes low-context—you have an entire mob to help you, after all.
Swati Swoboda is a Development Manager at Shopify. She has been at Shopify for 3.5 years and currently leads the Shipping Platform team.
In 2020, Shopify celebrated 15 years of coding, building, and changing the global commerce landscape forever. In that time, the team built an enormous amount of tooling, products, features, and an insanely scalable architecture.
With the velocity and pace we’ve been keeping, through growing surface areas that enable commerce for 8% of the world’s adult population and with an evolving architecture to support our rapid rate of development, the platform complexity has increased exponentially. Despite this, we still look hard problems straight in the face and decide that despite how complex it seems, it's what we want as a business. We can and will do this.
We’ve taken on huge engineering programs in the past that cross over multiple areas of complexity on the platform. These teams deliver features such as the Storefront Renderer, world class performance for events like BFCM, platform wide capacity planning and testing, and efficient tooling for engineers at Shopify like static typing.
Shopify has a playbook for running these engineering programs and we’d like to share it with you.
All programs require a clearly defined definition of done or the North Star if you will. This clarity and alignment is absolutely essential to ensure the team is all going in the same direction. For us, a number of documented assets are produced that enable company wide alignment and provide a framework for contextual status updates, risk mitigation, and decisions.
To be aligned is for all stakeholders to agree on the Program Plan in its entirety:
the length of time
the scope of the Program
the staffing assigned
the outcomes of the program.
The program stakeholders are typically Directors and VPs for the area the program will affect. Any technical debt or decisions made along the way are critical for these stakeholders as they inherit it as leaders of that area. The Program Steering Committee includes the Program Stakeholders and the selected Program Lead(s) who together define the program and set the stage for the team to move into action. Here’s how we frame it out:
Problem Statement
Exactly what is the issue? This is necessary for buy-in across executives and organizational leaders. Be clear, be specific. Questions we ask include
What can our users or the company do after this goal is achieved?
Why should we solve this problem now?
What aren’t we doing in order to prioritize this?
Is that the right tradeoff for the company?
Objectives of Program
Objectives of the program become a critical drum for motivation and negotiation when resources become scarce or other programs are gaining momentum. To come up with good objectives, consider answers to these questions:
When we’re done, what’s now possible?
As a company, what do we gain for choosing to invest in this effort over the countless other investments?
What can merchants, developers, and Shopify do after this goal is achieved?
What aren’t we doing in order to prioritize this?
Is that the right tradeoff for the company?
Guiding Principles of the Program
What guiding principles govern the solution? Spend time on this as it’s a critical tool for making tradeoff decisions or forcing constraints in solutions.
Definition of Done
Define what exactly needs to be true for this problem to be solved and what constitutes a passing grade for this definition both at the program and for each workstream level. The definition of done for the program is specifically what the stakeholders group is responsible to deliver on. The definition of done for each workstream is what the program contributors are responsible to deliver. Program Leads are responsible to manage both. It includes
a checklist for each team to complete their contribution
a performance baseline
a resiliency plan and gameday
complete internal documentation
external documentation.
Defining these expectations early and upfront makes it clear for all contributors and workstream leads what their objective is while also supporting strong parallelization across the team.
Top Risks and Mitigation
What are the top realistic things that could prevent you from attaining the definition of done, and what’s the plan of action to de-risk them? This is an active evolution. As soon as you mitigate one, it's likely another is nipping at your heels. These risks can be and often are technical, but sometimes they’re resource risks if the program doesn’t get the staffing needed to start on the planned schedule.
Path to Done
You know where you are and you know where you need to be. How are you going to get there and as a result and what’s the timeline? Based on the goals for the program’s definition of done, project scope or staffing become the levers to manipulate the plans by holistically looking at the other company initiatives to ensure total company success and not over optimizing for a single program.
These assets become the framework for aligning, staffing, and executing the program with the Program Stakeholders who use all these assets to decide exactly how the Program is executed, what it will achieve exactly, how much staff is needed and for how long. With this clarity, then it's a matter of execution that is one of the most nebulous parts of large, high stakes programs, and there’s no perfect formula. Eisenhower said, “Plans are worthless, but planning is indispensable.” He’s so accurate. It's the implementation of the plan that creates value and gets the company to the North Star.
Executing the Program
Here’s what works for my team of 200 that crosses nine sub-organizations that each have their own senior leadership team, roadmap, and goals.
Within Shopify R&D, we run in six week cycles company wide. The Definition of Done defined as part of the Program Plan acts as a primary reinforcing loop of the program until the goal is attained, that is, have we reached the North Star? Until that answer is true, we continue working in cycles to deliver on our program. Every new cycle factors in:
unachieved goals or regressions from the previous cycle
any new risks that need to be addressed
the goals expected based on the Path to Done.
Each cycle kicks off with clarity on goals, then moves to get it done or in Shopify terms: GSD (get shit done).
Six week cycle structure
This execution structure takes time to absorb and learn. In practice, it's not this flow of working or even aligning on the Program Plan that’s the hardest part, rather it’s all the things that hold the program together along the way. It's how you work within the cycle and what rituals you implement that are critical aspects of keeping huge programs on track. Here’s a look at the rituals my team implements within our 200 person and 92 project program. We have many types of rituals: Weekly Rituals, Cycle Rituals performed every six weeks, and ad hoc rituals.
Weekly Rituals
Company Wide Program Update
Frequency: The Company Wide Program Update is done weekly. We like the start of the week reflecting on the previous.
Why this is important: The update informs stakeholders and others on progress in every active workstream based on our goals. It supports Program Leads by providing an async, detailed pulse of the project.
Trigger: A recurring calendar item that’s scheduled in two events:
Draft the update.
Review the update.
It holds us accountable to ensure we communicate on a predictable schedule.
Approach: Programs Leads have a shared template that adds to the predictably our stakeholders can expect from the update. The template matches the format used cycle to cycle, but specifically the exact language and layout as the cycle goals presented in the Program Stakeholder Review. A consistent format allows everyone to interpret the plan easily.
We follow the same template every week and update the template cycle to cycle as the goals for the next cycle changes. This is prioritized on Monday mornings. The update is a mechanism to dive into things like the team’s risks, blockers, concerns, and celebrations.
Throughout the day, Program Leads collaborate on the document identifying tripwires that signal our ad hoc rituals or unknowns that require reaching out to teams. If the Program Leads are able to review and seek out any missing information by the review meeting, we cancel and get the time back. If not, we have the time and can wrap the document up together.
Deliverable: A weekly communication delivered via email to stakeholders on the status against the current cycle.
Program Lead and Project Lead Status Check-in
Frequency: Lead and Champion Status Check-in is done weekly at the start of the week to ensure the full team is aligned.
Why this is important: Team Leads and Champions complete project updates by end of day Friday to inform the Company Wide Program Update for Monday. This status check-in is dedicated space, if and when we need it, for cycle updates, program updates, or housekeeping.
Trigger: A recurring calendar item.
Approach: The recurring calendar item has all Project Leads on the attendee list. Often, the sync is cancelled as we finish the Company Wide Program Update. If there are a few missing updates, all but those Leads are excused from the sync. By completing the Company Wide Program Update, Program Leads identify which projects are selected for a Program Touch Base ritual.
Deliverable: Accurate status of each project and likelihood to reach the as defined cycle goal. It informs the weekly Company Wide Program Update.
Escalation Triage
Frequency: Held at a minimum weekly, though mostly ad hoc.
Why this is important: This is how we ensure we’re removing blockers, making decisions, and mitigating risks that could affect our velocity.
Trigger: A recurring calendar item called Weekly Program Lead Sync.
Approach: A GitHub project board is used to manage and track the Program. Tags are used to sort urgency and when things need to be done. Decisions are often the outcome of escalations. These are added to the decision log once key stakeholders are fully aligned.
Escalations are added by Program Leads as they come up allowing us to put them into GitHub with the right classifications to allow for active management. As Program Leads, we tune into all technical designs, project updates, and team demos for many reasons, but one advantage is we can proactively identify escalations or blockers.
Deliverable: Delegate ownership to ensure a solution is prioritized among the program team. The escalations aggregate into relevant items in the Program Stakeholder Review as highlights of blockers or solutions to blockers.
Risk Triage
Frequency: Held at a minimum weekly, though also ad hoc.
Why this is important: This is also how we ensure we’re removing blockers, making decisions and mitigating risks that could affect our velocity. This is how we proactively clear the runway.
Trigger: A recurring calendar item called Weekly Program Lead Sync.
Approach: In our planning spreadsheet, we have a ranking formula to prioritize the risks. This means we’ve identified what risks that need mitigation first, where the risk lives within the entire program, and who’s the Lead that’s assigned a mitigation strategy. We also include a last updated date to the status of the mitigation. This allows us to jump in and out at any cadence without accidentally putting undue pressure on the team to have a strategy immediately or poking them repeatedly. The spreadsheet shows who has had time to develop a mitigation strategy and allows us to monitor its implementation. Once there’s a plan, we update the sheet with the mitigation plan and status of implementation. It’s only once the plan is implemented that we change the ranking and actually mitigate our top risks.
Updating and collaborating is done with comments in the spreadsheet. Between Slack channels and the spreadsheet, you can see progress on these strategies. This is a great opportunity for Program Leads to be proactive and pop in these channels to celebrate and remind the team we just mitigated a big risk. Then, the spreadsheet is updated either by the Team Lead or the Program Lead, depending on who's more excited.
Deliverable: Delegate ownership to ensure a mitigation plan is prioritized among the program team. The escalations aggregate into relevant items in the Program Stakeholder Review as highlights of blockers or solutions to blockers.
Program Lead Sync
Frequency: Held weekly and ad hoc as needed.
Why this is important: This is where the Program Leads to strategize, collaborate, and divide and conquer. Program Leads are accountable for the Program’s success. These Leads partner to run the Program and are accountable to deliver on the definition of done by planning cycle after cycle. They must work together and stay highly aligned.
Trigger: A recurring calendar item.
Approach: We have an automatic agenda for this to ensure we tighten our end of week rituals, but also to stay close to the challenges, risks, and wins of the team. We try to minimalize our redundancy in coverage. Our agenda starts with three basic bullets:
Real Talk: What is on your mind, and what is keeping you up at night. It's how we stay close and ensure we’re partnering and not just coordinated ships in the night.
Demo Plan: What messaging if any should we deliver during the demo since the entire Program team has joined?
Divide and Conquer: What meetings can we drop to reduce redundancy.
Risk Review: What are the top risks, and how are the mitigation plans shaping up?
Throughout the week, agenda items are added by either Program Lead that ensures we have a well rounded conversation about the aspects of the Program that are top of mind for the week. Often these items tend to be escalations that could affect the Program velocity or a Project’s Scope.
Deliverable: A communication and messaging plan for weekly demos where the team fully gathers, risk levels, mitigation plans based on time passed, and new information or tooling changes.
Weekly Demos
Frequency: Held weekly.
Why this is important: Weeks one to five is mainly time for the team to share and show off their hard work and contribution to the goals. Week six is to show off the progress on the planned goals to our stakeholders.
Trigger: Scheduled in the calendar for the end of day on Fridays.
Approach: There are two things that happen in prep for this ritual:
planning demo facilitation
planning demos.
Planning demos: Any Champion can sign up for a weekly demo. A call for demos is made about two days in advance, and teams inform their intention on the planning spreadsheet: a weekly check mark if they will demo.
Planning demo facilitation: Program Leads and domain area leadership facilitate the event and deliver announcements, appropriately timed messaging, and demos. Of course, we also have fun and carve out a team vibe. We do jokes and welcome everyone with music. The demos identified are called on one by one to demo, answer team questions and share any milestones achieved.
Deliverable: A recorded session available to the whole company to review and ask further questions. It’s included in the weekly Company Wide Program Updates.
Cycle Rituals Performed Every Six Weeks
Cycle Kick Off
Frequency: Held every new cycle start: day one of week one.
Why this is important: This aligns the team and reminds us what we’re all working towards. We share goals, progress, and welcome new team members or workstreams. It also allows the team to understand what other projects are active in parallel to theirs, allowing them to proactively anticipate changes and collaborate on shared patterns and approaches.
Trigger: A recurring calendar item.
Approach: We host a team sync up, the entire program team is invited to participate. We try to keep it short, exciting, and inspiring. We raise any reminders on things that have changed, like the definition of done and office hours to help repeat the support in place for the whole team.
Deliverable: A presentation to the team delivered in real-time that highlights the cycle’s investment plan, overall progress on the Program and some of the biggest areas of risk the next six weeks for the team.
Mid-Cycle Goal Iteration
Frequency: Held between weeks one and three in a given cycle but no more than once per project.
Why this is important: Goals aren’t always realistic when set, but it's only after starting that it’s realized. Goals aren’t a jail cell, they’re flexible and iterative. Leads are empowered in weeks one to three to change their cycle goal so long as they communicate why and provide a new goal that’s attainable within the remaining time.
Trigger: Week three
Approach: In weeks one to three, Leads leverage Slack to share how their goal is evolving. This evolution and the effect on the subsequent cycles left in the program plan needs to be understood. Leads do this as needed, however in week three there’s a reminder paired with Goal Setting Office Hours.
Deliverable: A detailing of the change in cycle goals since kick off, and its impact on the overall project workstream and program path to be done.
Goal Setting Office Hours
Frequency: Held between weeks three to five in a given cycle.
Why this is important: In week three, time is carved off for reviewing current cycle goals. In week four and week five, the time is focused on next cycle goals. This is how we build a plan for the next cycle’s goals intentionally rather than rushing once the Program Stakeholder meeting is booked. It's how we’re aligned for the week one kick off.
Trigger: Week three
Approach: This is done with a recurring calendar on the shared program calendar and paired with a sign up sheet. Individuals then add themselves to the calendar invite.
This isn’t a frequently used process, but does give comfort to leads that the support is there and the time is carved off. The Program Touch Base ritual tends to catch risks and velocity changes in advance of Goal Setting Office Hours, but we have yet to determine if they should be removed altogether.
Deliverable: A change in the cycle’s current goal, the overall project workstream, and program path to be done, including staffing changes.
Cycle Report Card
Frequency: Held every six weeks.
Why this is important: This is a moment of gratitude and reflection on what we've achieved, and how we did so together as a team.
Trigger: Week Six
Approach: In week five, Slack reminds Leads to start thinking about this. Over the next week, the team drips in nominations to highlight some of the best wins from the team on performance and values we hold such as being collaborative, merchant/partner/developer obsessed, and resourceful.
This is done in a templated report card where we reflect back on what we wanted to achieve and update the team so they can see the velocity and impact of their work. Then, we celebrate.
This is delivered and facilitated by Program Leads where Team Leads are the ones delivering the praise in a full team sync up. We believe this not only helps create a great team and working environment, but also helps demonstrate alignment among the Program Leads. It helps us all get to know our large team and strengths better.
Deliverable: A celebratory section in the Cycle Kick off presentation reflecting back on individual contributions and team collaborations aligned to the company values.
Program Lead Retro of the Previous Cycle
Frequency: Held every six weeks, skipping the first cycle of the program.
Why this is important: This enables recurring optimization of how the Program is run, the rituals and the team’s health. It ensures that we’re tracking towards a great working experience for staff while balancing critical goals for the company. It’s how Program Leads and Project leads get better at executing the Program, leading the team and managing the Program stakeholders.
Trigger: A new cycle in a program. Typically the retro is held in week one after Project Lead’s have shared their Retro feedback.
Approach: This retro is facilitated through a stop start and continue workshop. It’s a simple, effective way to reflect on recent experiences and decide on what things should change moving forward. Decisions are based on what we learned in the cycle, and what we'll to stop doing, start doing, and continue doing?
A few questions are typically added to get the team thinking about aspects of feedback that should be provided
How are Program Leads working together as a team?
How Program Leads are managing up to Program Stakeholders?
How Project Leads are managing up to Program Leads?
What feedback is our Team Leads telling us?
How is the execution of the Program going within each team?
This workshop produces a number of lessons that drive change on the current rituals. Starting in week two, the Lead Sync is held to review and discuss how we’re iterating rituals in this cycle. Program Leads aim to implement the changes and communicate to the broader team by the end of week two so we have four weeks of change in place to power the next cycle’s retro.
Deliverable: A documented summary of each aspect of the retro described above available company wide and included in the Program Stakeholder Company Wide Update.
Project Lead Retro of Previous Cycle
Frequency: Held every six weeks, skipping the first cycle of the program.
Why this is important: Project Leads have the option to run the retro as part of their rituals.
This enables recurring optimization of how a Project is run within the Program, the rituals, and the team’s health. It’s how Project Leads get better at executing Projects, leading the team, and working within a larger Program.
Trigger: A new cycle in a program.
Typically the retro is held in week six or week one while the cycle is fresh. Even if the Project Lead has decided not to run a retro, they still may at the request of a Program Lead.
Approach: Project Leads are not prescribed an approach beyond the general Get Shit Done recommendations that already exist within Shopify. The main point of the exercise is not how it's run, but the outcome of the exercise.
Program Leads share an anonymous feedback form in advance of week six. This asks for what the team is going to stop, start and continue but also at the Program level. Then, we include an open ended section to distill lessons learned. These lessons are shared back with all Project Leads so we’re learning from each other. This generates a first team vibe for all Project Leads who have teams contributing to the program. First team is a concept from Patrick Lencioni where true leaders prioritize supporting their fellow leaders over their direct reports.
It’s important for teams who want to go far and fast as this mindset is transformational in creating high performing teams and organizations. This is because a strong foundation of trust and understanding makes it significantly easier for the team to manage change, be vulnerable, and solve problems. At the end of the day, ideas or plans don’t solve problems; teams do.
Deliverable: Iteration plan on the rituals, communication approaches, and tooling that continues to remove as many barriers and as much complexity from the team’s path.
Program Stakeholder Review
Frequency: Held every six weeks, often in early week six.
Why this is important: This is where Program Stakeholders review the goals for the upcoming cycle, set expectations, escalate any risks necessary, or discuss scope changes based on other goals and decisions. This is viewed in context to the cycle ahead, but also the overall Program Plan.
Trigger: Booked by the VP office.
Approach: Program Leads provide a status update of the previous cycle and the goals for the upcoming cycle in visual format. Program Leads leverage the Weekly Sync to make a plan on how we’d like to use this time with the stakeholders so we’re aligned on the most important discussion points and can effectively use the Program Steering Committee's time.
Deliverable: A presentation that highlights progress, the remaining program plan, open decisions, and escalations that require additional support to manage.
Program Stakeholder Company Wide Update
Frequency: We aim to do this at least once a cycle, often at the beginning of week four right in time to clarify the program changes following Mid-Cycle Goal Iteration.
Why is this important: Shopify is a very transparent company internally, it's one of the ways we work that allows us to move so fast. Sharing the Program Status and the evolution cycle to cycle creates an intense collaboration environment, ensuring teams have the right information to spot dependencies and risks as an outcome of this program. It supports Program Leads as well by helping clarify exactly where their team fits in the larger picture by providing an async, detailed pulse of the program.
Trigger: A recurring calendar item that’s scheduled in two events:
Draft the update.
Review the update.
It holds us accountable to ensure we communicate on a predictable schedule.
Approach: Programs Leads have a shared template that adds to the predictably our stakeholders can expect from the update. The template matches the overall program layout, specifically the exact language and layout as the Program was framed at the time of kickoff. A consistent format allows everyone to interpret the plan easily. The update is a mechanism to dive into things like the program risks, blockers, concerns, and milestones.
Throughout the day, Program Leads collaborate on the document identifying areas that could use more attention and support, highlighting changes to the overall plan, updating forecasting numbers, and most often, celebrating being on track!
Deliverable: A communication delivered via email to stakeholders on the status of the overall program.
Ad Hoc Rituals
The ad hoc rituals are the ones that somehow hold the whole thing together, even through the most turbulent situations. They are the rituals triggered by intuition, experience, and context that pull out the minor technical and operational details that have the potential to significantly affect the scope, trajectory or velocity of the Program. These rituals navigate the known unknowns and unknown unknowns hidden in every project in the program.
Assumption Slam Workshop
Frequency: Held ad hoc, but critical within the first month of kick off.
Why this is important: The nature of these programs is a complex intersection of Product, UX, and Engineering. This is a workshop to align the team and decrease unclear communications or decisions rooted in assumptions. This workshop is a mechanism to surface those assumptions, and the resulting lift to ensure this is well managed and doesn’t become a blocker.
Trigger: Ad hoc
Approach: In weeks one to three the Program Leads facilitate a guided workshop that we call an Assumption Slam. The group should be small as you’ll want to have a meaningful and actionable discussion. The workshop should be facilitated by someone who has enough context on the program to ask questions that lead the team to the root of the assumption and underlying impacts that require management or mitigation. You’ll also want to ensure the right team members are included to ensure you are challenging plans at the right intersections.
Deliverable: The key items identified in this section shift to action items. Mitigate the risk, finalize a decision, or complete a deeper investigation.
Program Touch base
Frequency: Ad Hoc
Why this is important: This is a conversational sync allowing the Project Lead to flag anything they feel relevant. This is how we stay highly aligned with the Leads and help them stay on course as much as possible.
Trigger: If something doesn’t seem right like:
A workstream's goals are off track for more than one week in a row and we haven’t heard from them.
A workstream's goals status moves from green to red without being in yellow.
A workstream isn’t making their team updates on a regular cadence.
A workstream’s Lead hasn't talked with us in a full cycle.
Otherwise it’s triggered, if we have new information that we need to talk about like another initiative that affects scope or dependencies or staffing changes.
Approach: We leverage few here and call the meeting Program Touch Base. Once that’s done, an agenda is automatically added with the following items:
Real Talk: What is on your mind and what is keeping you up at night. It's how we stay close and ensure we’re partnering and not just coordinated ships in the night.
Confidence in cycle and full workback:
Based on the goal you have for this cycle, are you confident you can deliver on it?
What about your Full schedule for the program?
What is your confidence in that estimate including time, staffing and scope?
What challenges or risks are in your way?
Performance: Speed, Scale, Resiliency:
How is the performance of your project shaping up?
Any concerns worth nothing that would risk you attaining the definition of done for your workstream?
What aren’t you doing? Program stakeholders typically will inherit any technical debt of decisions. By asking this, Project Leads can identify items for the roadmap backlog.
Deliverable: This engagement often leads to action items such as dependency clarification, risk identification and decision making.
Engineering Request for Comments (RFC)
Frequency: Held ad hoc but critical during technical design phases or after performance testing analysis.
Why is this important: Technical Design is good for rapid consensus building. In Engineering Programs, we need to align quickly on small technical areas, rather than align on the entire project direction. There’s significant overlap between the changes being shipped and the design exploration.
Trigger: Ad hoc
Approach: Using an async-friendly approach in GitHub, Engineers follow a template and rules of engagement. If alignment isn’t reached by the deadline date and no one has explicitly “vetoed” the approach, how to proceed becomes the decision of the RFC author.
Deliverable: A technical, architectural decision that is documented.
Performance Testing
Frequency: Held ad hoc, on the component and integrated into the system.
Why is this important: This is critical to the Program and to Shopify. It's a core attribute of the product and minimally, can’t be regressed on. It, however, can also be improved on. Those improvements are key call outs used in the Cycle Report Card.
Trigger: Deploying to Production.
Approach: Teams design a load test for their component by configuring a shop and writing a Lua script that’s orchestrated through our internal tooling named Genghis. Teams validate the performance against the Service Level Indicators we are optimizing for as part of the program, and if it’s a pass, aim to fold their service into a complete end to end test where the complexity of the system will rear its head.
This is done through async discussion as well as office hours hosted by the Program’s performance team. The Performance team documents the context being shared and inherits the end to end testing flows and associated shops. Yes, multiple shops and multiple flows. This is because services are tested at the happy path, but also with the maximum complexity to understand how the system behaves, and what to expect or fix.
Deliverable: First and foremost, it's a feedback loop validating to teams that the service meets the performance expectations. Additionally, the Performance team can now run recurring tests to monitor for regressions and stress on any dimension desired.
Engineering Program Management is still an early craft and evolves to the specific needs of the program, organization of the company, and management structure among the teams involved. We hope a glimpse into how we’ve run a 200+ person engineering program of 90 projects helps you define how your Engineering Program ought to be designed. As you start that journey, remember that not all rituals are necessary. In our experience, we find they’re important to attaining the objectives as close as possible and doing so with a happy and healthy team. It’s the combo of all of these calendar-based and ad hoc rituals that have allowed Shopify to achieve our goals quarter after quarter.
We’d love to hear how you are running engineering programs and how our approaches contrast! Reach out to us on Twitter at @ShopifyEng.
Carla Wright is an Engineering Program Manager with a focus on Scalability. She's been at Shopify for five years working across the organization to guide technical transformation, focusing on product and infrastructure bottlenecks that impact a merchant’s ability to scale and grow their business.
We're planning to DOUBLE our engineering team in 2021 by hiring 2,021 new technical roles (see what we did there?). Our platform handled record-breaking sales over BFCM and commerce isn't slowing down. Help us scale & make commerce better for everyone.
At Shopify, we’ve developed our own patterns in order to support our global platform. Before coming here, I've developed multiple Ruby (and Rails) applications at multiple growth stages. Because of that, I quickly came to appreciate some workarounds and automation that were created to support the large codebase of Shopify.
If there’s something I appreciate about Ruby on Rails, it’s the principle of convention over configuration it’s been built with. This enables junior developers to build higher quality code than in other languages, simply by following conventions. Conventions are also great when moving to a new Rails application: the file structure is always familiar.
But this makes it harder to go outside conventions. When people ask me about the biggest challenges of Ruby, I usually say it’s easy to start, but hard to become an expert. Everything is so abstracted, so one must be really curious and take the time to understand how Ruby and specifically Rails actually work.
Our monolith, Shopify Core, employs many of the common Rails conventions. This ranges from the default application structure, to the usage of in-built libraries like the Active Record ORM, Active Model, or Ruby gems like FrozenRecord.
At Shopify, we implement what most merchants need, most of the time. Similarly, the Rails framework also provides the infrastructure that most developers need, most of the time. Therefore, we had to find creative ways to make the largest Rails monolithic application maintainable.
When ready to join Shopify as a developer, my goal is that this blog post is useful to you whether you are new to Ruby, or if you’ve worked with Ruby on other projects in the past.
Dev
I would like to give the first mention to our command line developer tool, dev. At Shopify, we have thousands of developers working on hundreds of active projects. Many of these projects,in the past, had their own workflows and instructions on setup, how to run tests, and so on.
We created dev to provide us with a unified workflow across a variety of projects. It gives us a way to specify and automate the installation of all the dependencies and includes the workflow items required to boot the project on macOS, from XCode to bin/rails db:migrate. This is probably the first Shopify-made infrastructure you’ll use when starting at Shopify. It’s easy to take it for granted, but dev is doing so much towards increasing our productivity.
Time is money and automations are one time efforts.
We believe consistency is important across development environments. Inconsistencies can lead to debugging nightmares and incorrect local behaviour. Even with the existing tools like chruby, bundler, and homebrew to manage dependencies, setup can be a multi-step tedious process, and it can be difficult to outline the processes that achieve the desired consistency. So, we standardise many of the commands we use at Shopify through dev.
One of the most powerful features of dev is the ability to spin up services, in multiple programming languages. That means each repo has the same base configuration, structure, and libraries. Our infrastructure team is constantly working to make dev better to ultimately increase developer productivity. Dev also abstracts environment variables. Whenever joining smaller companies, one would spend days “fishing” environment variables before getting a few connected systems up and running.
Dev also enables Shopify developers to enable and disable integrations with interconnected services. This is usually manually changed through environment variables or configuration types.
Lastly, dev even abstracts command aliases! Ruby is already pretty good on commands, but when looking at tools, the commands can get super long. And this is where aliases help us developers save time, as we can make shortcuts for longer commands. So Shopify took this to the next level: why let developers set up their environment if they can get a baseline configuration, right through dev? This also helps standardise commands across projects, regardless of the programming language. For example, before I'd use the Hub package for opening PR’s. Now, I just use dev open pr.
Pods
Shopify core has a podded architecture, which means that the database is split into an arbitrary number of subsets, each containing a distinct subset of shops. Each pod runs Shopify independently, with a database containing a portion of our shops. The concept is based on the shard database infrastructure pattern. The Rails framework already has the pod/shard structure built-in. It was implemented with Shopify’s usage in mind and in collaboration with Github. In comparison with the shard database pattern, we’re expanding it to the full infrastructure. That includes provisioning, deployment, load balancers, caching, and servers. If one pod shuts down temporarily, the other pods aren’t affected. If you’d like to learn more about the infrastructure behind this, check out our blog post about running Kafka on Kubernetes at Shopify.
Horizontally scaling out our monolith was the fastest solution to handling our load.
Shopify is not just a software as a service company. It’s a platform able to generate full websites for millions of merchants. Whenever we deliver our services to merchants, we look at data in the context of the merchant's store. And that’s why we split everything by shop, including:
Incoming HTTP requests
Background jobs
Asynchronous events
That’s why every table in a podded database is connected to a shop. The shop is necessary for podding—our solution for horizontal scaling. And the link helps us avoid having data leaks between shops.
At Shopify, we love monoliths. The same way microservices have their challenges, so do monoliths, but these are challenges we're excited to try and solve.
Splitting concerns became a necessity to support delivery in our growing organization.
We did split our code in domains, but that’s about all we split. Traditionally, we’d see no link between domains besides public or internal APIs. But our database is still common for all domains, and everything is still linked to the Shop. This means we’re breaking domain boundaries every time we call Shop from another domain. As mentioned earlier, this is a necessity for our podded architecture. This is where it becomes trickier: every time we’re instantiating a model outside our domain, we’re ignoring component boundaries and we receive a warning for it. But, because the shop is already part of every table, the shop is practically part of every domain.
Something else you may be surprised by is we don’t enforce any relationships between tables on the database layer. This means the foreign keys are enforced only at the code level through models.
And, even though we use ActiveRecord migrations (not split by pods), running all historical migrations wouldn’t be feasible. Because of that, we only use migrations in the short term. Every month or so, we merge our migrations in a raw sql file which holds our database structure. This avoids the platform running migrations for hours, aging back 10 years. This blog post, Pros and Cons of Using structure.sql in Your Ruby on Rails Application, explains in more detail the benefits of using a structure.sql file.
Standardizing How We Write code
We expect to hire over 2000 this year. How can we control the quality of the code written? We do it by detecting repetitive mistakes. There are so many systems Shopify created to address this, ranging from gems to generators.
We built safeguards to keep quality levels up in a fast scaling organization.
One of the tools often used that’s implemented by us is the translation platform: a system handling creation, translation, and publication of translations directly through git.
In smaller companies, you’d just receive translations from the marketing team to embed in the app, or just get it through a CRM. This is certainly not enough when it comes to globalizing such a large application. The goal is to enable anyone to release their work while translations are being handled asynchronously, and it definitely saves us a lot of time. All we need to do is push the English version, and all the strings are automatically sent to a third party system where translators can add their translations. Without any input from the developers, the translations are directly committed back in our repos. The idea was first developed during Shopify hack days back in 2017. To learn more, check out this blog post about our translation platform.
Our maintenance task system also deserves a memorable mention. It’s built over the rails Active Job library, but has been adapted to work with our podded infrastructure. In a nutshell, it’s a Rails engine for queuing and managing maintenance tasks. In case you’d like to look into it, we’ve made this project open source.
In our monolith, we’ve also set up tons of automatic tests letting us know when we’re taking the wrong approach, and limits were put in to avoid overloading our system when spawning jobs.
Another system that standardizes how we do things is Monorail. Initially inspired by Airbnb Jitney, Monorail enforces schemas for widely used events. It creates contracts between Kafka producers and consumers through a defined structure of the data sent through JSON. Some benefits are
With unstructured events, events with different structure would end up as part of the same data warehouse table. Monorail creates a contract between developers and data scientists through schemas. If it changes, it has to be done through versioning.
It also helps to prevent Personal Identifiable Information (PII) leaks. We have a process to review Schemas to annotate PII fields so that they can be automatically scrubbed (obfuscated, tokenized).
I’ve covered many different topics herein this introduction to all of the awesome features we’ve set up to increase our productivity levels and focus on what matters: shipping great features. If you decide to join us, this overview should give you enough background to help you take the right approach at Shopify from the beginning.
Ioana Surdu-Bob is a Developer at Shopify, working on the Shopify Payments team. She’s passionate about personal finance and investing. She’s trying to help everyone build for financial independence through Konvi, a crowdfunding platform for alternative assets.
Wherever you are, your next journey starts here! If building systems from the ground up to solve real-world problems interests you, our Engineering blog has stories about other challenges we have encountered. Intrigued? Visit our Engineering career page to find out about our open positions and learn about Digital by Default.
Welcome back to part two of the Understanding GraphQL for Beginners series. In this tutorial, we’ll build GraphQL fields about food! If you did not read part one of this series, please read it before reading this part.
As a refresher, GraphQL is a data manipulation and query language for APIs. The two main benefits of implementing GraphQL are
The ability to describe the structure you want back as your response.
Only needing one endpoint to consume one or more resources.
Learning Outcomes
Examine the file directory of GraphQL.
Identify the difference between root fields and object fields.
Create a GraphQL object based on an existing Ruby on Rails model.
Create a GraphQL root field to define the structure of your response.
Use a GraphQL root field to query data within a database.
Examine how the GraphQL endpoint works.
Before You Start
Download the repository to follow along in this tutorial. The repository has been set up with models and gems needed for GraphQL. Once downloaded, seed the database.
The following models are
Food
Attribute
Type
id
Bigint
Name
String
place_of_origin
String
image
String
created_At
Timestamp
updated_at
Timestamp
Nutrition
Attribute
Type
id
Bigint
food_id
Bigint
serving_size
String
calories
String
total_fat
String
trans_fat
String
saturated_fat
String
cholesterol
String
sodium
String
Potassium
String
total_carbohydrate
String
dietary_fiber
String
sugars
String
protein
String
vitamin_a
String
vitamin_c
String
calciuum
String
iron
String
created_at
Timestamp
update_at
Timestamp
GraphQL File Structure
Everything GraphQL related is found in the folder called “graphql” under “/app”. Open up your IDE editor, and look at the file structure under “graphql”.
Directory structure of the folder graphql
In the yellow highlighted box, there are two directories here:
“Mutations” This folder contains classes that will modify (create, update or delete) data.
“Types” This folder contains classes that define what will be returned. As well as the type of queries (mutation_type.rb and query_type.rb) that can be called.
In the red highlighted box, there’s one important file to note.
Directory structure of the folder graphql
The class food_app_schema.rb, defines the queries you can make.
Creating Your First GraphQL Query all_food
We’re creating a query that returns us a list of all the food. To do that, we need to create fields. There are two kinds of fields:
Root fields define the structure of your response fields based on the object fields selected. They’re the entry points (similar to endpoints) to your GraphQL server.
Object fields are attributes of an object.
We create a new GraphQL object called food. On your terminal run rails g graphql:object food. This will create the file food_type.rb filled with all the attributes found in your foods table in db/schema.rb. Your generated food_type.rb will look like:
This class contains all the object fields, exposing a specific data of an object. Next, we need to create the root field that allows us to ask the GraphQL server for what we want. Go to the file query_type.rb that’s a class that contains all root fields.
Remove the field test_field and its method. Create a field called all_food like below. As food is both a singular and plural term, we use all_food to be plural.
The format for field is as followed:
The field name (:all_food).
The return type for the field ([Types::FoodType]).
Whether the field will ever be null (null: false). By setting this to false, it means that the field will never be null.
The description of the field (description: "Get all the food items.").
Congratulations, you’ve created your first GraphQL query! Let’s go test it out!
How to Write and Run Your GraphQL Query
To test your newly created query, we use the playground, GraphiQL, to execute the all_food query. To access GraphiQL, add the following URI to your web address: localhost:3000/graphiql.
You will see this page:
GraphiQL playground
The left side of the page is where we will write our query. The right side will return the response to that query.
Near the top left corner next to the GraphiQL text contains three buttons:
GrapiQL playground menus
This button will execute your query.
This button will reformat your query to look pretty.
This button will show all previous queries you ran.
On the right corner of the menu bar is a button called “< Docs”.
Docs menu item
If you click on the “< Docs” button in the top right corner, you can find all the possible queries based on your schema.
Document explorer
The queries are split into two groups, query and mutation. “query” which contains all queries that do not modify data. Queries that do modify data can be found in “mutation”. Click on “query: Query” to find the “all_food” query we just created.
Query screen
After clicking on “query: Query”, you will find all the possible queries you can make. If you click on [Food!]!, you will see all the possible fields we can ask for.
Fields in the all_food query
These are all the possible fields you can use within your all_food query.Remember, GraphQL allows us to describe exactly what we need. Let’s say we only want the ids and names of all food items. We write the query as
Click the execute button to run the query. You get the following response back:
Awesome job! Now, create another query to get the image and place_of_origin fields back:
You will get this response back.
What’s Happening Behind the Scenes?
Recall from part one, GraphQL has this single “smart” endpoint that bundles all different types of RESTful actions under one endpoint. This is what happens when you make a request and get a response back.
When you execute the query:
You call the graphql endpoint with your request (for example, query and variables).
The graphql endpoint then calls the execute method from the graphql_controller to process your request.
The method renders a JSON containing a response catered to your request.
You get a response back.
Try it Yourself #1
Try to implement the root field called nutrition. Like all_food, it returns all nutrition facts.
You may have noticed that the nutrition table contains a foreign key, where a food item has one nutrition fact. Currently, it’s associated at the model level but not used at the GraphQL level. For someone to query food and get the nutrition fact as well, we need to add a nutrition field to food.
Add the following field to food_type.rb:
field :nutrition, Types::NutritionType, null: true
Let’s execute the following query where we want to know the serving size and calories of each food item:
You will get this response back:
Hooray! We now know the serving size and calories of each food item!
So far, we learned how to create root fields to query all data of a specific resource. Let’s write a query to look at data based on id.
Writing a Query with an Argument
In query_type.rb, we need to add another root field called food that requires and takes an argument called id:
On GraphiQL, let’s execute this query:
You will get this response back:
Try it Yourself #2
This time, create a root field called find_food, which returns a set of data based on place_of_origin.
As we’ve reached the end of this tutorial, let’s recap what we learned!
GraphQL generates and populates an object if the model with the same name exists.
Root fields define the structure of your response and are entry points to your GraphQL server.
Object fields are an object’s attributes.
All requests are processed by the graphql_controller’s execute method and return a JSON response back.
I hope you enjoyed creating some GraphQL queries! One thing you might still be wondering is how do we update these ActiveRecord objects? In part 3 of Understanding GraphQL for Beginners, we’ll continue creating queries called mutations that create, update, or delete data.
If you would like to see the finished code for part two, check out the branch called part-2-solution.
Often mistaken as an intern, Raymond Chung is building a new generation of software developers through Shopify's Dev Degree program. As a Technical Educator, his passion for computer science and education allows him to create bite-sized content that engages interns throughout their day-to-day. When he is not teaching, you'll find Raymond exploring for the best bubble tea shop.
We're planning to DOUBLE our engineering team in 2021 by hiring 2,021 new technical roles (see what we did there?). Our platform handled record-breaking sales over BFCM and commerce isn't slowing down. Help us scale & make commerce better for everyone.
As developers, we’re always passionate about learning new things! Whether it’s a new framework or a new language, our curiosity takes us places! One term you may have heard of is REST. REST stands for REpresentational State Transfer - a software architecture style introduced by Roy Fielding in the year 2000, with a set of principles on how a web application should behave. Think of this as a guideline of operations, like how to put together a meal. One of the principles is that one endpoint should only do one CRUD action (either create, read, update, or delete). As well, each RESTful endpoint returns a fixed set of data. I like to think of this as a cookie-cutter response, where you get the same shape back every time. Sometimes you may only need less data, and other times you may need more data. This can lead to the issue of calling additional APIs to get more data. How can we get exactly the right amount of data and under one call?
As technology evolves, one thing that contrasts REST and is gaining popularity is GraphQL. But what is it exactly? Within this blog, we will learn what GraphQL is all about!
Learning Outcomes
Explain what GraphQL is.
Use an analogy to deepen your understanding of GraphQL.
Explain the difference between REST and GraphQL.
Before You Start
If you are new to API development, here are some terminologies for reference. Otherwise, continue ahead.
API
What is API?
Application Programming Interface (API) allows two machines to talk to each other. You can think of it as the cashier who takes your request to the kitchen to prepare and gives you your meal when ready.
Why are APIs important?
APIs allow multiple devices like your laptop and phone to talk to the same backend server. APIs that use REST are RESTful.
REST
What is REST?
REpresentational State Transfer (REST) is a software architecture style on how a web application should behave. Think of this as a guideline of operations, like how to put a meal together.
Why is REST important?
REST offers a great deal of flexibility like handling different types of calls and responses. It breaks down a resource into CRUD services, making it easier to organize what each endpoint should be doing. One of REST’s key principles is client-server separation of concerns. This means that any issues that happen on the server are only concerned by the server. All the client cares about is getting a response back based on their request to the server.
Latency Time
What is latency time?
Latency time is the time it takes for your request to travel to the server to be processed. You can think of this like driving from point A to B. Sometimes there are delays due to traffic congestion.
Why is latency time important?
The lower the latency, the faster the request can be processed by the server. The higher the latency, the longer it takes for your request to be processed.
Response Time
What is response time?
Response time is the sum of latency time and the time it takes to process your request. Think of this as the time it takes since you ordered your meal.
Why is response time important?
Like latency, the faster the response time, the more seamless the overall experience feels for users. The slower the response time, the less seamless it feels for users, and they may quit your application.
What Is GraphQL?
GraphQL is an open-source data query and manipulation language for APIs, released publicly by Facebook in 2015.
Unlike REST, GraphQL offers the flexibility for clients to describe the structure of the data they need in the form of a query. No more and no less. The best part is it's all under one endpoint! The response back will be exactly what you described, and not a cookie-cutter response.
For example, provided below, we have three API responses about the Toronto Eagles, their championships, and their players. If we want to look at the year the Toronto Eagles were founded, the first and last name of the team captain and their last championship, we need to make three separate RESTful calls.
Call 1:
Call 2:
Call 3:
When you make an API call, it’s ideal to get a response back within a second. The response time is made up of latency time and processing time. With three API calls, we are making three trips to the server and back. You may expect that the latency times for all three calls would be the same. That will never be the case. You can think of latency like driving in traffic, sometimes it's fast, and sometimes it's slow due to rush hour. If one of the calls is slow, that means the overall total response time is slow!
Luckily with GraphQL, we can combine the three requests together, and get the exact amount of data back on a single trip!
GraphQL query:
GraphQL response:
GraphQL Analogies
Here are two analogies to help describe how GraphQL compares to REST.
Analogy 1: Burgers
Imagine you are a customer at a popular burger restaurant, and you order their double cheeseburger. Regardless of how many times you order (calling your RESTful API), you get every ingredient in that double cheeseburger every time. It will always be the same shape and size (what’s returned in a RESTful response).
Photo by amirali mirhashemian on Unsplash.
With GraphQL, you can “have it your way” by describing exactly how you want that double cheeseburger to be. I’ll take a double cheeseburger with fewer pickles, cheese not melted, bacon on top, sautéed onions on the bottom, and finally no sesame seeds on the bottom bun.
Your GraphQL response is shaped and sized to be exactly how you describe it.
Photo by amirali mirhashemian on Unsplash.
Analogy 2: Banks
You are going to the bank to make a withdrawal for $200. Using the RESTful way, you won’t be able to describe how you want your money to be. The teller (response) will always give you two $100 bills.
RESTful response:
Two $100 bills
By using GraphQL, you can describe exactly how you want your denominations to be. You can request one $100 bill and five $20 bills.
GraphQL response:
One $100 bill and five $20 bills
REST Vs GraphQL
Compared to RESTful APIs, GraphQL provides more flexibility on how to ask for data from the server. It provides four main benefits over REST:
No more over fetching extra data. With REST APIs, a fixed set of data (same size and shape response) is returned. Sometimes, a client doesn’t need all the data. GraphQL solves this by having the clients grab only what they need.
No more under fetching data. Sometimes, a client may need more data. Additional calls must be made to get data that an endpoint may not have.
Rapid product iterations on the front end. Flexible structure catered to clients. Frontend developers can make UI changes without asking the backend developers to make changes to cater frontend design changes.
Fewer endpoints. Calling too many endpoints can get confusing really fast. GraphQL’s single “smart” endpoint bundles all different types of RESTful actions under one.
By leveraging GraphQL’s principles of describing the structure of the data you want back, you don’t need to make multiple trips for some cookie-cutter responses. Read part two of Understanding GraphQL for Beginners as we’ll implement GraphQL to a Ruby on Rails application, and create and execute queries!
Often mistaken as an intern, Raymond Chung is building a new generation of software developers through Shopify's Dev Degree program. As a Technical Educator, his passion for computer science and education allows him to create bite-sized content that engages interns throughout their day-to-day. When he is not teaching, you'll find Raymond exploring for the best bubble tea shop.
We're planning to DOUBLE our engineering team in 2021 by hiring 2,021 new technical roles (see what we did there?). Our platform handled record-breaking sales over BFCM and commerce isn't slowing down. Help us scale & make commerce better for everyone.
Rate limiting is a system that protects the stability of APIs. GraphQL opens new possibilities for rate limiting. I’ll show you Shopify’s rate limiting system for the GraphQL Admin API and how it addresses some limitations of common methods commonly used in REST APIs. I’ll show you how we calculate query costs that adapt to the data clients need while providing a more predictable load on servers.
What Is Rate Limiting and Why Do APIs Need It?
To ensure developers have a reliable and stable API, servers need to enforce reasonable API usage. The most common cases that can affect platform performance are
Bad actors abusing the API by sending too many requests.
Clients unintentionally sending requests in infinite loops or sending a high number of requests in bursts.
The traditional way of rate limiting APIs is request-based and widely used in REST APIs. Some of them have a fixed rate (that is clients are allowed to make a number of requests per second). The Shopify Admin REST API provides credits that clients spend every time they make a request, and those credits are refilled every second. This allows clients to keep a request pace that never limits the API usage (that is two requests per second) and makes occasional request bursts when needed (that is making 10 requests per second).
Despite widely used, the request-based model has two limitations:
Clients use the same amount of credits regardless, even if they don’t need all the data in an API response.
POST, PUT, PATCH and DELETE requests produce side effects that demand more load on servers than GET requests, which only reads existing data. Despite the difference in resource usage, all these requests consume the same amount of credits in the request-based model.
The good news is that we leveraged GraphQL to overcome these limitations and designed a rate limiting model that better reflects the load each request causes on a server.
The Calculated Query Cost Method for GraphQL Admin API Rate Limiting
In the calculated query cost method, clients receive 50 points per second up to a limit of 1,000 points. The main difference from the request-based model is that every GraphQL request has a different cost.
Let’s get started with our approach to challenges faced by the request-based model.
Defining the Query Cost for Types Based on the Amount of Data it Requests
The server performs static analysis on the GraphQL query before executing it. By identifying each type used in a query, we can calculate its cost.
Objects: One Point
The object is our base unit and worth one point. Objects usually represent a single server-side operation such as a database query or a request to an internal service.
Scalars and Enums: Zero points
You might be wondering, why do scalars and enums have no cost? Scalars are types that return a final value. Some examples of scalar types are strings, integers, IDs, and booleans. Enums is a special kind of scalar that returns one of a predefined set of values. These types live within objects that already have their cost calculated. Querying additional scalars and enums within an object generally comes at a minimum cost.
In this example, shop is an object, costing 1. id, name, timezoneOffsetMinutes, and customerAccountsreturn are scalar types that cost 0. The total query cost is 1.
Connections: Two Points Plus The Number of Returned Objects
Connections express one-to-many relationships in GraphQL. Shopify uses Relay-compliant connections, meaning they follow some conventions, such as compounding them by using edges, node, cursor, and pageInfo.
The edges object contains the fields describing the one-to-many relationship:
node: the list of objects returned by the query.
cursor: our current position on that list.
pageInfo holds the hasPreviousPage and hasNextPage boolean fields that help navigating through the list.
The cost for connections is two plus the number of objects the query expects to return. In this example, a connection that expects to return five objects has a cost of seven points:
cursor and pageInfo come free of charge as they’re the result of the heavy lifting already made by the connection object.
This query costs seven points just like the previous example:
Interfaces and Unions: One point
Interfaces and unions behave as objects that return different types, therefore they cost one point just like objects do.
Mutations: 10 points
Mutations are requests that produce side effects on databases and indexes, and can even trigger webhooks and email notifications. A higher cost is necessary to account for this increased server load so they’re 10 points.
Getting Query Cost Information in GraphQL Responses
You don’t need to calculate query costs by yourself. The API responses include an extension object that includes the query cost. You can try running a query on Shopify Admin API GraphiQL explorer and see its calculated cost in action.
The request:
The response with the calculated cost displayed by the extension object:
Getting Detailed Query Cost Information in GraphQL Responses
You can get detailed per-field query costs in the extension object by adding the X-GraphQL-Cost-Include-Fields: true header to your request:
Understanding Requested Vs Actual Query Cost
Did you notice two different types of costs on the queries above?
The requested query cost is calculated before executing the query using static analysis.
The actual query cost is calculated while we execute the query.
Sometimes the actual cost is smaller than the requested cost. This usually happens when you query for a specific number of records in a connection, but fewer are returned. The good news is that any difference between the requested and actual cost is refunded to the API client.
In this example, we query the first five products with a low inventory. Only one product matches this query, so even though the requested cost is seven, you are only charged for the four points calculated by the actual cost:
Measuring the Effectiveness of the Calculated Query Cost Model
The calculated query complexity and execution time have a linear correlation
By using the query complexity calculation rules, we have a query cost that’s proportional to the server load measured by query execution time. This gives Shopify the predictability needed to scale our infrastructure, giving partners a stable platform for building apps. We can also detect outliers on this correlation and find opportunities for performance optimization.
Rate limiting GraphQL APIs by calculating the amount of data clients query or modify adapts more to the use case of each API client better than a request-based model commonly used by REST APIs. Our calculated query cost method benefits clients with good API usage because it encourages them to request only the data they need, providing servers with a more predictable load.
Guilherme Vieira is a software developer on the API Patterns team. He loves building tools to help Partners and Shopifolk turn their ideas into products. He grew up a few blocks from a Formula 1 circuit and has been a fan of this sport ever since.
We're planning to DOUBLE our engineering team in 2021 by hiring 2,021 new technical roles (see what we did there?). Our platform handled record-breaking sales over BFCM and commerce isn't slowing down. Help us scale & make commerce better for everyone.
As more clients rely on GraphQL to query data, we witness performance and scalability issues emerging. Queries are getting bigger and slower, and net-new roll-outs are challenging. The web & mobile development teams working on Orders & Fulfillments spent some time exploring and documenting our approaches. On mobile, our goal was to consistently achieve a sub one second page load on a reliable network. After two years of scaling up our Order screen in terms of features, it was time to re-think the foundation on which we were operating to achieve our goal. We ran a few experiments in mobile and web clients to develop strategies around those pain points. These strategies are still a very open conversation internally, but we wanted to share what we’ve learned and encourage more developers to play with GraphQL at scale in their web and mobile clients. In this post, I’ll go through some of those strategies based on an example query and build upon it to scale it up.
1. Designing Our Base Query
Let’s take the case of a client loading a list of products. To power our list screen we use the following query:
Using this query, we can load the first 100 products and their details (name, price, and image). This might work great, as long as we have fewer than 100 products. As our app grows we need to consider scalability:
How can we prepare for the transition to a paginated list?
How can we roll out experiments and new features?
How can we make this query faster as it grows?
2. Loading Multiple Product Pages
Good news, our products endpoint is paginated on Shopify’s back-end side and can now implement the change on our clients! The main concern on the client side is to find the right page size because it could also have UX and Product implications. The right page size will likely change from one platform to another because we’re likely to display fewer products at the same time on the mobile client (due to less space). This weighs on the performances as the query grows.
In this step, a good strategy is to set performance tripwires, that is create some kind of score (based on loading times) to monitor our paginated query. Implementing pagination within our query immediately reduces the load on the back-end and front-end side if we opt for a lower number than the initial 100 products:
We add two parameters to control the page size and index. We also need to know if the next page is available to show, hence the hasNextPage field. Now that we have support for an unlimited amount of products in our query, we can focus on how we roll out new fields.
3. Controlling New Field Rollouts
Our product list is growing in terms of features, and we run multiple projects at the same time. To make sure we have control on how changes are rolled out in our ProductList query we use @include and @skip tags to make optional some of the net-new fields we’re rolling out. It looks like this:
In the example above the description field is hidden behind the $featureFlag parameter. It becomes optional, and you need to unwrap its value when parsing the response. If the value of $featureFlag is false, the response will return it as null.
The @include and @skip tags require any new field to keep the same naming and level as renaming or deleting those fields will likely result in breaking the query. A way around this problem is to dynamically build the query at runtime based on the feature flag value.
Other rollout strategies can involve duplicating queries and running a specific query based on feature flags or working off a side branch until rollout and deployment. Those strategies are likely project and platform specific and come with more trade-offs like complexity, redundant code, and scalability.
The @include and @skip tags solution is handy for flags on hand, but what about for conditional loading based on remote flags? Let’s have a look at chained queries!
4. Chaining Queries
From time to time you’ll need to chain multiple queries. A few scenarios where this might happen are
Your query relies on a remote flag that comes from another query. This makes rolling out features easier as you control the feature release remotely. On mobile clients with many versions in production, this is useful.
A part of your query relies on a remote parameter. Similar to the scenario above, you need the value of a remote parameter to power your field. This is usually tied to back-end limitations.
You’re running into pagination limitations with your UX. You need to load all pages on screen load and chain your queries until you reach the last page. This mostly happens in clients where the current UX doesn’t allow for pagination and is out of sync with the back-end updates. In this specific case solve the problem at a UX level if possible.
We transform our local feature flag into a remote flag and this is what our query looks like:
In the example above, the RemoteDescriptionFlag query is executed first, and we wait for its results to start the ProductsList query. The descriptionEnabled (aliased to remoteFlag) powers the @include inside our ProductsList query. This means we’re now waiting for two queries at every page or screen load to complete before we can display our list of products. It significantly slows down our performance. A way to work around this scenario is to move the remote flag query outside of this context, probably at an app-wide level.
The TL;DR of chained queries: only do it if necessary.
5. Using Parallel Queries
Our products list query is growing significantly with new features:
We added search filters, user permission, and banners. Those three parts aren’t tied to the products list pagination because if they were included in the ProductsList query, we have to re-query those three endpoints every time we ask for a new page. It slows down performance and gives redundant information. This doesn’t scale well with new features and endpoints, so this sounds like a good time to leverage parallel querying!
Parallel querying is exactly what it sounds like: running multiple queries at the same time. By splitting the query into scalable parts and leaving aside the “core” query of the screen, it brings the benefits to our client:
Faster screen load: since we’re querying those endpoints separately, the load is transferred to the back-end side instead. Fragments are resolved and queried simultaneously instead of being queued on the server-side. It’s also easier to scale server-side than client-side in this scenario.
Easier to contribute as the team grows: by having one endpoint per query, we diminish the risk of code conflict (for example, fixtures) and flag overlapping for new features. It also makes it easier to remove some endpoints.
Easier to introduce the possibility of incremental and partial rendering: As queries are completed, you can start to render content to create the illusion of a faster page load for users.
Removes the redundant querying by leaving our paginated endpoint in its own query: we only query for product pages after the initial query cycle.
Here’s an example of what our parallel queries look like:
Whenever one of those queries becomes too big, we apply the same principles and split again to accommodate for logic and performances. What’s too big? As a client developer, it’s up to you to answer this question by setting up goals and tripwires. Creating some kind of trackable score for loading time can help you make the decision on when to cut the query in multiple parts. This way the GraphQL growth in our products list is more organic ( an outcome that looks at scalability and developer happiness) and doesn't impact performance: each query can grow independently and reduces the amount of potential roll-out & code merge conflicts.
Just a warning when using parallel queries, when transferring the load server-side, make sure you set tripwires to avoid overloading your server. Consult with site reliability experts (SREs or at Shopify, production engineers), and back-end developers, they can help monitor the performances server-side when using parallel querying.
Another challenge tied to parallel queries, is to plug the partial data responses into the screen state’s. This is likely to require some refactor into the existing implementation. It could be a good opportunity to support partial rendering at the same time.
Over the past four years, I have worked on shipping and scaling features in the Orders mobile space at Shopify. Being at the core of our Merchants workflow gave me the opportunity to develop empathy for their daily work. Empowering them with better features meant that we had to scale our solutions. I have been using those patterns to achieve that, and I’m still discovering new ones. I love how flexible GraphQL is on the client-side! I hope you’ll use some of these querying tricks in your own apps. If you do, please reach out to us, we want to hear how you scale your GraphQL queries!
Théo Ben Hassen is a development manager on the Merchandising mobile team. His focus is on enabling mobile to reach its maximum impact through mobile capabilities. He's interested about anything related to mobile analytics and user experience.
We're planning to DOUBLE our engineering team in 2021 by hiring 2,021 new technical roles (see what we did there?). Our platform handled record-breaking sales over BFCM and commerce isn't slowing down. Help us scale & make commerce better for everyone.
The Polaris team creates tools, education and documentation that helps unite teams across Shopify to build better experiences. We created Polaris, our design system, and continue to maintain it. We are a multidisciplinary team with a range of experience. Some people have been at Shopify for over 6 years and others, like me, are a part of our Dev Degree program.
Mental models within an industry, company, or even a person, change constantly. As methodologies mature, we see the long term effects our choices have wrought and can adjust accordingly. As a team or company grows, methodologies that worked well for five people may not work as well for 40 people. If all employees could keep an entire app in their head, we’d need fewer rules and checks and balances on our development, but that is not the case. As a result, we summarize things we notice have been implicit in our work.
How would we build a web application only using the standard Ruby libraries? In this article, I’ll break down the key foundational concepts of how a web application works while building one from the ground up. If we can build a web application only using Ruby libraries, why would we need web server interfaces like Rack and web applications like Ruby on Rails? By the end of this article, you’ll gain a new appreciation for Rails and its magic.
There are dependencies between gems and the platforms that use them. In scenarios where the platforms have the data and the gem has the knowledge, there is a direct circular dependency between the two and both need to talk to each other. I’ll show you how we used the Repository pattern in Ruby to remove that circular dependency and help us make gems thin and stateless. Plus, I’ll show you how using Sorbet in the implementation made our code typed and cleaner.
Rounding is used to simplify the use of numbers that contain more decimal places than required. The perfect example is representing cash, money, dough. In the USA and Canada, the cent represents the smallest fraction of money. The US and Canadian dollar can’t be transacted with more than 2 decimal places. When numbers represent money, we use rounding to replace an un-representable, un-transactable money amount with one that represents a cash tender.
The best way to introduce this blog is by asking you to watch a scene from one of my favorite movies, Office Space:
In this scene, Peter describes to his girlfriend a program that compounds interest using high precision amounts. He explains that they simplify the calculations by rounding the amounts down and by doing that they’re left with hanging pennies that they transfer into their personal accounts.
This is exactly what we want to avoid—we want to avoid having one developer aware of hanging pennies. We also want to avoid having many hanging pennies. And when faced with such a situation, we want to identify such calculations and put a plan in place on who to notify and what to do with them.
Before I explain this further, I want to tell you this story first. My father introduced banking software systems in the Middle East in the late 70’s. Rest assured he was bound to round. He faced the same issue Peter faced. He resolved it by accepting that he can’t resolve it. So, he created an account where the extra pennies accumulated and later were given as bonuses to the IT team at the bank. It was a way of getting back at the rest of the employees at the bank that didn’t want to move to using a software system and preferred pen and paper.
The Rounding Dilemma
Okay, let’s get back to breaking this problem down further with another example.
Let’s assume we can only charge 1 total amount, even if this 1 amount consists of a summation of multiple rates.
Rate 1 is 2.4% Rate 2 is 2.9% Amount $10.10
When rounding individual rate amounts: Rate 1 total = (rate /100) * $10.10 = 0.2424 = rounded = 0.24 Rate 2 total = (rate /100) * $10.10 = 0.2929 = rounded = 0.29 Total = 0.24 + 0.29 = 0.53
When rounding total of the rate amounts: Rate 1 total = (rate /100) * $10.10 = 0.2424 Rate 2 total = (rate /100) * $10.10 = 0.2929
Total = 0.2424 + 0.2929 = 0.5353 = rounded = 0.54
The example above makes it clear that deciding when to round can either make you more money by collecting the loose penny or lose money by deciding to let go of it.
Rounding at different stages in the example above has more impact if there are currency conversions involved. As a rule of thumb, the more currency conversions (which also involve rounding) and more rounding, the more we lose precision along the way.
Rational numbers are natural products of various banking calculations: distributed payments, shared liabilities, and rates applied. So, you’ll face other rounding encounters in many other places in financial software, most notably while calculating taxes or discounts and, just like in Office Space, while calculating interest.
Did it make cents? I hope you have a grasp on the problem. Now, is this avoidable? No, it’s not. If you’re working on financial software you’ll eventually be bound to round. But, we can control where and how to handle the precision loss. I’m sharing 8 tips to make your precision obsessive compulsiveness a bit less troubling to you as a developer and to the company as a business.
1. Notify Stakeholders
Show and tell where the rounding happens within your calculations to the stakeholders of your project. Explain the impact of the rounding, document it, and keep talking about it until all leaders on your team and within your department are aware. You, as a developer, don’t have to take the full burden of knowing that the company is making less than 1 cent on some transactions because of the calculations you put in place. Is a problem really a problem if it’s everyone’s problem?!
2. Use Banker’s Rounding
There are many types of rounding. There are rounding methods that increase bias and rounding methods that decrease bias. Banker’s rounding is the method proven to decrease rounding bias within calculations. Banking rounding deliberately distorts some of the rounded values to bring rounding totals of rounded numbers as close to the totals of the original numbers. Talking about why regular rounding taught in schools can’t meet our needs and why Banker’s rounding is mostly used for financial calculations would turn this blog into a math lesson, and as much as I would love to do that, I’d probably lose many readers.
3. Use Data Types That Hold the Most Precision
Within your calculations, ensure that all variables used are data types that can hold as much precision as possible (can hold enough decimal points). For example, using a double instead of a float. It’s important to keep the precision wherever there isn’t rounding involved as it reduces the amount of hanging pennies.
4. Be Consistent
I mean, this applies to a lot of things in life. When you and your team decide on which rounding methods to use, ensure that the same rounding method is used throughout your code.
5. Be Explicit About Rounding
When rounding within your calculation make it explicit by either adding comments or prefix rounded variables with “rounded_”. This ensures that anyone reading your code understands where precision loss is happening. Link to documentation about rounding strategies within your code documentation.
6. Refer to Government Rounding Standards
The 1040 U.S. Individual Income Tax Return form
Losing precision is a universal problem and not only suffered by mathematicians. Refer to your government’s ruling around rounding. When it comes to tax calculations, governments might have different rules. Refer to them and educate yourself and your team.
7. Round Only When You Absolutely Have To
Remember, only tender money amounts need to be rounded. Whenever you can avoid rounding, do so!
8. Tell Your Users
Please don’t hide what rounding methods you use to your users. Many users will try to reverse engineer calculations on their own, and as a company you don’t want to end up explaining this several times. Ensure rounding rules are explicitly written in your documentation and easily accessible.
Be Merchant Obsessed
At Shopify, we are, of course, bound to round. If you are a Shopify merchant reading this post I want to assure you that in all our calculations, developers are biased towards benefiting our merchants. Not only are our support teams merchant obsessed, all Shopify developers are too.
Dana is a senior developer on the Money team at Shopify. She’s been in software engineering since 2007. Her primary interests are back-end development, database design, and software quality management. She's contributed to a variety of products, and since joining Shopify she's been on the Shopify Payments and Balance teams. She recently switched to data development to deliver impactful money insights to our merchants.
We're planning to DOUBLE our engineering team in 2021 by hiring 2,021 new technical roles (see what we did there?). Our platform handled record-breaking sales over BFCM and commerce isn't slowing down. Help us scale & make commerce better for everyone.
For companies like Shopify that practice continuous deployment, our code is changing multiple times every day. We have to de-risk new features to ship safely and confidently without impacting the million+ merchants using our platform. Beta flags are one approach to feature development that gives us a number of notable advantages.
GraphQL is the syntax that describes data that a client asks from a server. The client, in this case, is a mobile application. GraphQL is usually compared with REST API, a common syntax that most mobile application developers use. We will share how GraphQL can solve some of the pain points of REST API in mobile application development and discuss tips and best practices that we learned at Shopify by using GraphQL in our mobile applications.
Why Use GraphQL?
A mobile application generally has four basic layers in the codebase:
Network layer: defines the connection and the server to connect to send/receive data.
Data model layer: translates data coming from the network layer to understandable data for local app models.
View models layer: translates data models to understandable models for the user interface.
User interface layer: presents/receives data to/from the user.
A network layer and data model layer are needed for an app to talk to a server and translate that information to view layers. GraphQL can fit into these two layers and base a data graph layer and solve most of the pain points mobile developers used to have when using REST APIs.
One of the pain points when using REST APIs is that the data coming from the server should be mapped many times to different object types in order to be presented on the screen or vice versa from input in the screen to be sent to the server. Simpler apps might have fewer of these mappings depending on if the app has a local database to store data or if the app is online only. But mobile apps surely have the mapping to convert the JSON data coming from an API to a class object (for example, Swift objects ).
When working with REST endpoints these mappings are basically matching statically typed code with the unstructured JSON responses. In other words, mobile developers are asked to hard code the type of a field and cast the JSON value to the assumed type. Sometimes developers validate and assert the type. These castings or validations might fail as we know the server is always changing and deprecating fields and objects. If that happens, we cannot fix the mobile application that is already released in the market without replacing those hard codes and assumptions. This is one of the bug-prone parts of the mobile application when working with REST endpoints. These changes will happen again and again during the lifetime of an application. The mobile developer’s job is to maintain those hard codes and keep the parity between the APIs response and the application mapping logic. Any change on server APIs has to be announced and that forces the mobile developers to update their code.
The problem described above can be somewhat alleviated by adding frameworks to control the flow and providing more API documentation, such as The OpenAPI Specification (OAS). However, this does not actually solve the problem as part of the endpoint itself, and adds a workaround or dependencies on different frameworks.
On the other side, GraphQL addresses the aforementioned concerns. GraphQL APIs are strongly typed and a self-documented contract between server and clients. Strongly typed means each type of data is predefined as part of the language. This makes it easy for clients to be always in sync with server data types. There are no more statical types in your mobile application and no JSON mapping with the static data types in the codebase. Mobile apps’ objects will always be synced with the server objects and developers will get the updates and deprecations at compile time.
GraphQL endpoints are defined by schemas. Introspection is the system in GraphQL that enables tooling systems to generate code for different languages and platforms. Deprecation is a good example of describing introspection. It can be added so that each field would have a isDeprecated boolean and a replicationReason. This GraphQL tool become very useful as it shows warnings and feedback on compile-time in a mobile project.
As an example, the below JSON is the response from an API endpoint:
The price field on product is received as a String type and the client has the mapping below to convert the JSON data in to a swift model:
Let price = product[“price”] as? String
This type casting is how a mobile application transfers the JSON data to understandable data for UI layers. Basically, mobile clients have to statically define the type of each field and this is independent of server’s objects.
On the other side, GraphQL removes these static type castings. Client and server will always be tightly coupled and in sync. In the example above, Product type will be in the schema in GraphQL documentation as a contract between client and server, and price will always be the type that is defined in that contract. So the client is no longer keeping static types for each field.
Trade-offs
Note that customization comes with a cost. It is the client developer's responsibility to keep the performance high while taking advantage of the customization. The choice between using REST API vs GraphQL is up to the developer based on the project but in general REST API endpoint is defined in a more optimized way. That means each endpoint only receives a defined input and it returns a defined output and no more than that. GraphQL endpoints can be customized and clients can ask for anything in a single request. But clients also need to be careful about the costs of this flexibility. We are going to talk about GraphQL query costs later but having cost doesn't mean we can't reach the same optimization as REST API with GraphQL. Query cost should be considered when taking advantage of the customization feature.
Tips and Best Practices
To use GraphQL queries in a mobile project, you need to have a code generator tool to generate the client-side files representing your GraphQL queries, mutations, and responses. The tool we use at Shopify is called Syrup. Syrup is open source and generates strongly-typed Swift and Kotlin codes based on the GraphQL queries used in your app. Let's look at some examples of GraphQL queries in a mobile application and learn some tips. The examples and screenshots are from Shopify POS application.
Fragments and Screens in Mobile Apps
Defining fragments usually depends on the application UI. In this example, the order details screen in Shopify POS application shows lineItems on an order but it also has a sub screen which shows an event on order with related lineItems. For example, order details on the top image and return event screen with the lineItems that are returned on the bottom.
In this example lineItem rows in both screens are exactly the same and the view to create that row receives exactly the same information to create the view. Assuming each screen calls a query to get the information they need. They both need the same fields on the lineItem object. So, OrderLineItem object is basically a shared object between more than one screen and also between more than one query in the app. With GraphQL query we define orderLineItem as a fragment so it can be reusable and it guarantees that the lineItem view gets all the fields it needs every time the app fetches lineItem using this fragment. See query examples below:
Fragments with Common Fields but Different Names
Fragments can be customized on the client side and usually in mobile applications very much depends on the UI. Defining more fragments does not affect query cost so it's free and it gives your query a good structure. A good tip about using fragments is that not only you can break down the fields into multiple fragments but also you can put the same fields in multiple fragments and again it does not add cost to the query. For example, sometimes applications present repetitive data in more than one screen. In our OrderDetails screen example, the POS app presents high-level payment information about the order in the orderDetails screen (such as: subtotal, discount, total, etc.), but order can have a longer payment history (including change, failed transactions, etc.). Order history is presented in sub screens if the user selects to see that information. Assuming we only call one query to get all the information, we can have two fragments: OrderPayments, OrderHistory.
See fragments below:
Defining these fragments makes it easier to pass the data around and it does not affect the performance or cost of query. We are going to talk more about query cost later.
Customize Query Response to Benefit your App’s UX
With GraphQL you are able to customize your query/mutation response for the benefit of your application UI. If you have used REST API for a mobile application before you will appreciate the power that GraphQL can bring into your app. For example, after calling a mutation on an Order object, you can define the response of the mutation call with the fields you need to build your next screen. If the mutation is adding a lineItem to an order object and your next screen is to show the total price of the order, you can define the response object to include the totalPrice field on order so you can easily build your UI without having to fetch the updated order object. See mutation example below:
This flexibility is not possible with REST API without asking the server team to change the response object for the specific REST API endpoint.
Use Aliases to Have Readable Data Models Based on your App’s UI
If you are building the UI based on directly using the GraphQL objects, you can use aliases to rename the fields anything you want. A small tip about using aliases is that you can use aliases to rename a field but also if you add an extension to the object you can have the original field’s name as a new variable with added logic. See example below:
Use Directives and Add Logic to Your Query
Directives are mentioned in GraphQL documentation as a way to avoid string manipulation for server side code, but it also has advantages for a mobile client. For example, for the Order details screen, POS needs different fields on order based on the type of an order. If order is a pickup order, the OrderDetails screen needs more information about fulfillments and does not need information about shipping details. With directives you can pass boolean variables from your UI to the query to include or skip fields. See below query example:
We can add directives on fragments or fields. This enables mobile applications to fetch only the data that the UI needs and not more than that. This flexibility isn’t possible with REST API endpoints without having two different endpoints and having code in the mobile app codebase to switch between endpoints based on the boolean variable.
GraphQL Performance
GraphQL gives all the power and simplicity to your mobile application and some work is now transferred to the server-side to give clients the flexibility. On the client side, we have to consider the costs of a query we build. The cost of the query affects performance directly as it affects the responsiveness of your application and the resources on the server. This is not something that is usually mentioned when talking about GraphQL, but at Shopify we care about performance on both client-side and server-side.
Different GraphQL servers might have different API rate limiting methods. At Shopify, calls to GraphQL APIs are limited based on calculated query cost, which means the cost of query per minute and is more important than the number of query calls per minute. Each field in the schema has an integer cost value, and the sum of all these costs will be the cost of the query we build on the client side.
In simple words, each user has a bucket of maximum query cost per minute and each second the bucket will be refilled after each query execution. Obviously, complex queries will take up a proportionally larger amount of that bucket. To be able to start an execution of a query bucket app should have enough room for the complexity of the request query. That is the reason why on the client side we should care about our calculated query cost. There are tips and ways to improve the query cost in general, as described here.
Future of GraphQL
GraphQL is more than just a graph query language. It’s language-independent and flexible to serve any platform’s needs. It is built to serve clients where network bandwidth, latency and UX is critical. We mentioned the pain points when using REST in mobile applications and how GraphQL can address many of those concerns. GraphQL allows you to build whatever you need for the client and fulfill it in your own way. GraphQL is already an immense move forward from REST API design, addressing directly the models of data that need to be transferred between each client and server to do the job. At Shopify, we believe in the future of GraphQL and that is why Shopify has offered APIs in GraphQL since 2018.
Mary is a senior developer in Retail at Shopify. She has tons of experience in Swift and iOS development in general, and has been coding Swift since 2014. She's contributed to a variety of apps and since joining Shopify she's been on the Point Of Sale (POS) app team. She recently switched to React Native and started learning JavaScript and React. If you want to connect with Mary, check her out on Twitter.
To create relevant search, processing clickstream data is key: you frequently want to promote search results that are being clicked on and purchased, and demote those things users don’t love.
Typically search systems think of processing clickstream data as a batch job run over historical data, perhaps using a system like Spark. But on Shopify’s Discovery team, we ask the question: What if we could auto-tune relevance in real-time as users interact with search results—not having to wait days for a large batch job to run?
At Shopify—this is what we’re doing! We’re using streaming data processing systems that can process both real-time and historic data to enable real-time use cases ranging from simple auto boosting or down boosting of documents, to computing aggregate click popularity statistics, building offline search evaluation sets, and on to more complex reinforcement learning tasks.
But this article is introducing you to the streaming system themselves. In particular, to Apache Beam. And the most important thing to think about is time with those streaming systems. So let’s get started!
What Exactly is Apache Beam?
Apache Beam is a unified batch and stream processing system. This lets us potentially unify historic and real-time views of user search behaviors in one system. Instead of a batch system, like Spark, to churn over months of old data, and a separate streaming system, like Apache Storm, to process the live user traffic, Beam hopes to keep these workflows together.
For search, this is rather exciting. It means we can build search systems that both rely on historic search logs while perhaps being able to live-tune the system for our users’ needs in various ways.
Let’s walk through an early challenge everyone faces with Beam: that of time! Beam is a kind of time machine that has to reorder events in their right spot after getting annoyingly delayed by lots of intermediate processing and storage step. This is one of the core complications of a streaming system - how long do we wait? How do we deal with late or out of order data?
So to get started with Beam, the first thing you’ll need to do is Hack Time!
The Beam Time Problem
At the core of Apache Beam are pipelines. They connect a source through various processing steps to finally a sink.
Data flowing through a pipeline is timestamped. When you consider a streaming system, this makes sense. We have various delays as events flow from browsers, through APIs, and other data systems. Finally the events arrive at our Beam pipeline. They can easily be out-of-order or delayed. Beam source APIs, like the one for Kafka, maintain a moving view of the event data to emit well-ordered events known as a watermark.
If we don’t give our Beam source good information on how to build a timestamp, we’ll drop events or receive them in the wrong order. But even more importantly for search, we likely must combine different streams of data to build a single view on a search session or query, like below:
Joining (a Beam topic for another day!) needs to look back over each source’s watermark and ensure they’re aligned in time before deciding that sufficient time has elapsed before moving on. But before you get to the complexities of streaming joins, replaying with accurate timestamps is the first milestone on your Beam-for-clickstream journey.
Configuring the Timestamp Right at the Source
Let’s set up a simple Beam pipeline to explore Beam. Here we’ll use Kafka in Java as an example. You can see the full source code in this gist.
Here we’ll set up a Kafka source, the start of a pipeline producing a custom SearchQueryEvent stored in a search_queries_topic.
You’ll notice we have information on the topic/servers to retrieve the data, along with how to deserialize the underlying binary data. We might add further processing steps to transform or process our SearchQueryEvents, eventually sending the final output to another system.
But nothing about time yet. By default, the produced SearchQueryEvents will use Kafka processing time. That is, when they’re read from Kafka. This is the least interesting for our purposes. We care about when users actually searched and clicked on results.
More interesting is when the event was created in a Kafka client. Which we can add here:
.withCreateTime(Duration.standardMinutes(5))
You’ll notice above, when we use create time below, we need to give the source’s Watermark a tip for how out of order event times might be. For example, below we instruct the Kafka source to use create time, but with a possible 5 minutes of discrepancy.
Appreciating The Beam Time Machine
Let’s reflect on what such a 5 minute possible delay actually means from the last snippet. Beam is kind of a time machine… How Beam bends space-time is where your mind can begin to hurt.
As you might be picking up, event time is quite different from processing time! So in the code snippet above, we’re *not* telling the computer to wait for 5 minutes of execution time for more data. No, the event time might be replayed from historical data, where 5 minutes of event time is replayed through our pipeline in mere milliseconds. Or it could be event time is really now, and we’re actively streaming live data for processing. So we DO indeed wait 5 real minutes!
Let’s take a step back and use a silly example to understand this. It’s really crucial to your Beam journey.
Imagine we’re super-robot androids that can watch a movie at 1000X speed. Maybe like Star Trek The Next Generation’s Lt Commander Data. If you’re unfamiliar, he could process input as fast as a screen could display! Data might say “Hey look, I want to watch the classic 80s movie, The Goonies, so I can be a cultural reference for the crew of the Enterprise.”
Beam is like watching a movie in super-fast forward mode with chunks of the video appearing possibly delayed or out of order relative to other chunks in movie time. In this context we have two senses of time:
Event Time: the timestamp in the actual 1h 55 minute runtime of The Goonies aka movie time.
Processing Time: the time we actually experience The Goonies (perhaps just a few minutes if we’re super-robot androids like Data).
So Data tells the Enterprise computer “Look, play me The Goonies as fast as you can recall it from your memory banks.” And the computer has various hiccups where certain frames of the movie aren’t quite getting to Data’s screen to keep the movie in order.
Commander Data can tolerate missing these frames. So Data says “Look, don’t wait more than 5 minutes in *movie time* (aka event time) before just showing me what you have so far of that part of the movie. This lets Data watch the full movie in a short amount of time, dropping a tolerable number of movie frames.
This is just what Beam is doing with our search query data. Sometimes it’s replaying days worth of historic search data in milliseconds, and other times we’re streaming live data where we truly must wait 5 minutes for reality to be processed. Of course, the right delay might not be 5 minutes, it might be something else appropriate to our needs.
Beam has other primitives such as windows which further inform, beyond the source, how data should be buffered or collected in units of time. Should we collect our search data in daily windows? Should we tolerate late data? What does subsequent processing expect to work over? Windows also work with the same time machine concepts that must be appreciated deeply to work with Beam.
Incorporating A Timestamp Policy
Beam might know a little about Kafka, but it really doesn’t know anything about our data model. Sometimes we need even more control over the definition of time in the Beam time machine.
For example, in our previous movie example, movie frames perhaps have some field informing us of how they should be arranged in movie time. If we examine our SearchQueryEvent, we also see a specific timestamp embedded in the data itself:
public class SearchQueryEvent {
public final String queryString;
public final Instant searchTimestamp;
…
}
Well Beam sources can often be configured to use a custom event time like our searchTimestamp. We just need to make a TimestampPolicy. We simply provide a simple function-class that takes in our record (A key-value of Long->SearchQueryEvent) and returns a timestamp:
We can use this to create our own timestamp policy:
Here, we’ve passed in our own function, and we’ve given the same allowed delay (5 minutes). This is all wrapped up in a factory class TimestampPolicyFactory SearchQueryTimestampPolicyFactory (now if that doesn’t sound like a Java class name, I don’t know what does ;) )
Beam is about hacking time, I hope you’ve appreciated this walkthrough of some of Beam’s capabilities. If you’re interested in joining me on building Shopify’s future in search and discovery, please check out these great job postings!
Doug Turnbull is a Sr. Staff Engineer in Search Relevance at Shopify. He is known for writing the book “Relevant Search”, contributing to “AI Powered Search”, and creating relevance tooling for Solr and Elasticsearch like Splainer, Quepid, and the Elasticsearch Learning to Rank plugin. Doug’s team at Shopify helps Merchants make their products and brands more discoverable. If you’d like to work with Doug, send him a Tweet at @softwaredoug!
On February 24, 2021, Shipit!, our monthly event series, presented Making Commerce Extensible with WebAssembly. The video is now available.
At Shopify we aim to make what most merchants need easy, and the rest possible. We make the rest possible by exposing interfaces to query, extend and alter our Platform. These interfaces empower a rich ecosystem of Partners to solve a variety of problems. The primary mechanism of this ecosystem is an “App”, an independently hosted web service which communicates with Shopify over the network. This model is powerful, but comes with a host of technical issues. Partners are stretched beyond their available resources as they have to build a web service that can operate at Shopify’s scale. Even if Partners’ resources were unlimited, the network latency incurred when communicating with Shopify precludes the use of Apps for time sensitive use cases.
We want Partners to focus on using their domain knowledge to solve problems, and not on managing scalable web services. To make this a reality we’re keeping the flexibility of untrusted Partner code, but executing it on our own infrastructure. We choose a universal format for that code that ensures it’s performant, secure, and flexible: WebAssembly.
“WebAssembly (abbreviated Wasm) is a binary instruction format for a stack-based virtual machine. Wasm is designed as a portable compilation target for programming languages, enabling deployment on the web for client and server applications.”
Wasm is often presented as a performant language that runs alongside JavaScript from within the Browser. We, however, execute Wasm outside of the browser and with no Javascript involved. Wasm, far from being solely a Javascript replacement, is designed for Web and Non-Web Embeddings alike. It solves the more general problem of performant execution in untrusted environments, which exists in browsers and code execution engines alike. Wasm satisfies our three main technical requirements: security, performance, and flexibility.
Security
Executing untrusted code is a dangerous thing—it's exceptionally difficult to predict by nature, and it has potential to cause harm to Shopify’s platform at large. While no application is entirely secure, we need to both prevent security flaws and mitigate their impacts when they occur.
Wasm executes within a sandboxed stack-based environment, relying upon explicit imports to allow communication with the host. Because of this, you cannot express anything malicious in Wasm. You can only express manipulations of the virtual environment and use provided imports. This differs from bytecodes which have references to the computers or operating systems they expect to run on built right into the syntax.
In ecommerce, speed is a competitive advantage that merchants need to drive sales. If a feature we deliver to merchants doesn’t come with the right tradeoff of load times to customization value, then we may as well not deliver it at all.
Wasm is designed to leverage common hardware capabilities that provide it near native performance on a wide variety of platforms. It’s used by a community of performance driven developers looking to optimize browser execution. As a result, Wasm and surrounding tooling was built, and continues to be built, with a performance focus.
Flexible
A code execution service is only as useful as the developers using it are productive. This means providing first class development experiences in multiple languages they’re familiar with. As a bytecode format, Wasm is targeted by a number of different compilers. This allows us to support multiple languages for developer use without altering the underlying execution model.
Community Driven
We have a fundamental alignment in goals and design, which provides our “engineering reason” for using Wasm. But there’s more to it than that—it’s about the people as well as the technology. If nobody was working on the Wasm ecosystem, or even if it was just on life support in its current state, we wouldn’t use it. WebAssembly is an energized community that’s constantly building new things and has a lot of potential left to reach. By becoming a part of that community, Shopify stands to gain significantly from that enthusiasm.
We’re also contributing to that enthusiasm ourselves. We’re collecting user feedback, discussing feature gaps, and most importantly contributing to the open source tools we depend on. We think this is the start of a healthy reciprocal relationship between ourselves and the WebAssembly community, and we expect to expand these efforts in the future.
Architecture of our Code Execution Service
Now that we’ve covered WebAssembly and why we’re using it, let’s move onto how we’re executing it.
We use an open source tool called Lucet (originally written by Fastly). As a company, Fastly provides a programmable edge cloud platform. They’re trying to bring execution of high-volume, short-lived, and untrusted modules closer to where they’re being requested. This is the same as the problem we’re trying to solve with our Partner code, so it’s a natural fit to be using the same tools.
Lucet
Lucet is both a runtime and a compiler for Wasm. Modules are represented in Wasm for the safety that representation provides. Recall that you can’t express anything malicious in Wasm. Lucet takes advantage of this and uses a validation of the Wasm module as a security check. After the validation, the module is compiled to an executable artifact with near bare metal performance. It also supports ahead of time compilation, allowing us to have these artifacts ready to execute at runtime. Lucet containers boast an impressive startup time of 35 μs. That’s because it’s a container that doesn’t need to do anything at all to start up. If you want the full picture, Tyler McMullan, the CTO of Fastly, did a great talk which gives an overview of Lucet and how it works.
A flow diagram showing Shopify's Wasm engine
We wrap Lucet within a Rust web service which manages the I/O and storage of modules, which we call the Wasm Engine. This engine is called by Shopify during a runtime process, usually a web request, in order to satisfy some function. It then applies the output in context of the callsite. This application could involve the creation of a discount, the enforcement of a constraint, or any form of synchronous behaviour Merchants want to customize within the Platform.
Execution Performance
Here’s some metrics pulled from a recent performance test. During this test, 100k modules were executed per minute for approximately 5 min. These modules contained a trivial implementation of enforcing a limit on the number of items purchased in a cart.
Time taken to execute a module
This chart demonstrates a breakdown of the time taken to execute a module, including I/O with the container and the execution of the module. The y-axis is time in ms, the x-axis is the time over which the test was running.
The light purple bar shows the time taken to execute the module in Lucet, the width of which hovers around 100 μs. The remaining bars deal with I/O and engine specifics, and the total time of execution is around 4 ms. All times are 99th percentiles (p99).To put these times in perspective, let’s compare these times to the request times of Storefront Renderer, our performant Online Store rendering service:
Storefront Renderer response time
This chart demonstrates the request time to Storefront Renderer over time. The y-axis is request time in seconds. The x-axis is the time over which the values were retrieved. The light blue line representing the 99th percentile hovers around 700 ms.
Then if we consider the time taken by our module execution process to be generally under 5 ms, we can say that the performance impact of Lucet execution is negligible.
Generating WebAssembly
To get value out of our high performance execution engine, we’ll need to empower developers to create compatible Wasm modules. Wasm is primarily intended as a compilation target, rather than something you write by hand (though you can write Wasm by hand). This leaves us with the question of what languages we’ll support and to what extent.
Theoretically any language with a Wasm target can be supported, but the effort developers spend to conform to our API is better focused on solving problems for merchants. That’s why we’ve chosen to provide first class support to a single language that includes tools that get developers up and running quickly.At Shopify, our language of choice is Ruby. However, because Ruby is a dynamic language, we can’t compile it down to Wasm directly. We explored solutions involving compiling interpreters, but found that there was a steep performance penalty. Because of this, we decided to go with a statically compiled language and revisit the possibility of dynamic languages in the future.
Through our research we found that developers in our ecosystem were most familiar with Javascript. Unfortunately, Javascript was precluded as it’s a dynamic language like Ruby. Instead, we chose a language with familiar TypeScript-like syntax called AssemblyScript.
Using AssemblyScript
At first glance, there are a huge number of languages that support a WebAssembly target. Unfortunately, there are two broad categories of WebAssembly compilers which we can’t use:
Compilers that generate environment or language specific artifacts, namely node or the browser. (Examples: Asterius, Blazor)
Compilers that are designed to work only with a particular Runtime. The modules generated by these compilers rely upon special language specific imports. This is often done to support a language’s standard library, which expects certain system calls or runtime features to be available. Since we don’t want to be locked down to a certain language or tool, we don’t use these compilers. (Examples: Lumen)
These are powerful tools in the right conditions, but aren’t built for our use case. We need tools that produce WebAssembly, rather than tools which are powered by WebAssembly. AssemblyScript is one such tool.
AssemblyScript, like many tools in the WebAssembly space, is still under development. It’s missing a few key features, such as closure support, and it still has a number of edge case bugs. This is where the importance of the community comes in.
The language and the tooling around AssemblyScript has an active community of enthusiasts and maintainers who have supported Shopify since we first started using the language in 2019. We’ve supported the community through an OpenCollective donation and continuing code contributions. We’ve written a language server, made some progress towards implementing closures, and have written bug fixes for the compiler and surrounding tooling.
We’ve also integrated AssemblyScript into our own early stage tooling. We’ve built integrations into the Shopify CLI which will allow developers to create, test, and deploy modules from their command line. To improve developer ergonomics, we provide SDKs which handle the low level implementation concerns of Shopify defined objects like “Money”. In addition to these tools, we’re building out systems which allow Partners to monitor their modules and receive alerts when their modules fail. The end goal is to give Partners the ability to move their code onto our service without losing any of the flexibility or observability they had on their own platform.
New Capabilities, New Possibilities
As we tear down the boundaries between Partners and Merchants, we connect merchants with the entrepreneurs ready to solve their problems. If you have ideas on how our code execution could help you and the Apps you own or use, please tweet us at @ShopifyEng. To learn more about Apps at Shopify and how to get started, visit our developer page.
Duncan is a Senior Developer at Shopify. He is currently working on the Scripts team, a team dedicated to enabling and managing untrusted code execution within Shopify for Merchants and Developers alike.
Shipit! Presents: Making Commerce Extensible with WebAssembly
If you love working with open source tools, are passionate about API design and extensibility, and want to work remotely, we’re always hiring! Reach out to us or apply on our careers page.
On December 16, 2020 we held Shipit! presents: Performance Tips from the Storefront Renderer Team. A video for the event is now available for you to learn more about how the team optimized this Ruby application for the particular use case of serving storefront traffic. Click here to watch the video.
By Celso Dantas and Maxime Vaillancourt
In the previous post about our new storefront rendering engine, we described how we went about the rewrite process and smoothly transitioned to serve storefront requests with the new implementation. As a follow-up and based on readers’ comments and questions, this post dives deeper into the technical details of how we built the new storefront rendering engine to be faster than the previous implementation.
To set the table, let’s see how the new storefront rendering engine performs:
It generates a response in less than ~45ms for 75% of storefront requests;
It generates a response in less than ~230ms for 90% of storefront requests;
It generates a response in less than ~900ms for 99% of storefront requests.
Thanks to the new storefront rendering engine, the average storefront response is nearly 5x faster than with the previous implementation. Of course, how fast the rendering engine is able to process a request and spit out a response depends on two key factors: the shop’s Liquid theme implementation, and the number of resources needed to process the request. To get a better idea of where the storefront rendering engine spends its time when processing a request, try using the Shopify Theme Inspector: this tool will help you identify potential bottlenecks so you can work on improving performance in those areas.
A simplified data schema of the application
Before we cover each topic, let’s briefly describe our application stack. As mentioned in the previous post, the new storefront rendering engine is a Ruby application. It talks to a sharded MySQL database and uses Redis to store and retrieve cached data.
Optimizing how we load all that data is extremely important. As one of our requirements was to improve rendering time for Storefront requests. Here are some of the approaches that we took to accomplish that.
Using MySQL’s Multi-statement Feature to Reduce Round Trips
To reduce the number of network round trips to the database, we use MySQL’s multi-statement feature to allow sending multiple queries at once. With a single request to the database, we can load data from multiple tables at once. Here’s a simplified example:
This request is especially useful to batch-load a lot of data very early in the response lifecycle based on the incoming request. After identifying the type of request, we trigger a single multi-statement query to fetch the data we need for that particular request in one go, which we’ll discuss later in this blog post. For example, for a request for a product page, we’ll load data for the product, its variants, its images, and other product-related resources in addition to information about the shop and the storefront theme, all in a single round-trip to MySQL.
Implementing a Thin Data Mapping Layer
As shown above, the new storefront rendering engine uses handcrafted, optimized SQL queries. This allows us to easily write fine-tuned SQL queries to select only the columns we need for each resource and leverage JOINs and sub-SELECT statements to optimize data loading based on the resources to load which are sometimes less straightforward to implement with a full-service object-relational mapping (ORM) layer.
However, the main benefit of this approach is the tiny memory footprint of using a raw MySQL client compared to using an object-relational mapping (ORM) layer that’s unnecessarily complex for our needs. Since there’s no unnecessary abstraction, forgoing the use of an ORM drastically simplifies the flow of data. Once the raw rows come back from MySQL, we effectively use the simplest ORM possible: we create plain old Ruby objects from the raw rows to model the business domain. We then use these Ruby objects for the remainder of the request. Below is an example of how it’s done.
Of course, not using an ORM layer comes with a cost: if implemented poorly, this approach can lead to more complexity leaking into the application code. Creating thin model abstractions using plain old Ruby objects prevents this from happening, and makes it easier to interact with resources while meeting our performance criteria. Of course, this approach isn’t particularly common and has the potential to cause panic in software engineers who aren’t heavily involved in performance work, instead worrying about schema migrations and compatibility issues. However, when speed is critical, we accept to take on that complexity.
Book-keeping and Eager-loading Queries
An HTTP request for a Shopify storefront may end up requiring many different resources from data stores to render properly. For example, a request for a product page could lead to requiring information about other products, images, variants, inventory information, and a whole lot of other data not loaded on multi-statement select. The first time the storefront rendering engine loads this page, it needs to query the database, sometimes making multiple requests, to retrieve all the information it needs. This usually happens during the request at any given time.
Flow of a request with the Book-keeping solution
As it retrieves this data for the first time, the storefront rendering engine keeps track of the queries it performed on the database for that particular product page and stores that list of queries in a key-value store for later use. When an HTTP request for the same product page comes in later (which it knows when the cache key matches), the rendering engine looks up the list of queries it performed throughout the previous request of the same type and performs those queries all at once, at the very beginning of the current request, because we’re pretty confident we’ll need them for this request (since they were used in the previous request).
This book-keeping mechanism lets us eager-load data we’re pretty confident we’ll need. Of course, when a page changes, this may lead to over-fetching and/or under-fetching, which is expected, and the shape of the data we fetch stabilizes quickly over time as more requests come in.
On the other side, some liquid models of Shopify’s storefronts are not accessed as frequently, and we don’t need to eager-load data related to them. If we did, we’d increase I/O wait time for something that we probably wouldn’t use very often. What the new rendering engine does instead is lazy-load this data by default. Unless the book-keeping mechanism described above eager-loads it, we’ll defer retrieving data to only load it if it’s needed for a particular request.
Implementing Caching Layers
Much like a CPU’s caching architecture, the new rendering engine implements multiple layers of caching to accelerate responses.
A critical aside before we jump into this section: adding caching should never be the first step towards building performance-oriented software. Start by building a solution that’s extremely fast from the get go, even without caching. Once this is achieved, then consider adding caching to reduce load on the various components on the system while accelerating frequent use cases. Caching is like a sharp knife and can introduce hard to detect bugs.
In-Memory Cache
A simplified data schema of the application with an in-memory cache for the Storefront Renderer
At the frontline of our caching system is an in-memory cache that you can essentially think of as a global hash that’s shared across requests within each web worker. Much like the majority of our caching mechanisms, this caching layer uses the LRU caching algorithm. As a result, we use this caching layer for data that’s accessed very often. This layer is especially useful in high throughput scenarios such as flash sales.
Node-local Shared Caching
As a second layer on top of the in-memory cache, the new rendering engine leverages a node-local Redis store that’s shared across all server workers on the same node. Since the database is available on the same machine as the rendering engine process itself, this node-local data transfer prevents network overhead and improves response times. As a result, multiple Ruby processes benefit from sharing cached data with one another.
Full-page Caching
Once the rendering engine successfully renders a full storefront response for a particular type of request, we store the final output (most often an HTML or JSON string) into the local Redis for later retrieval for subsequent requests that match the same cache key. This full-page caching solution lets us prevent regenerating storefront responses if we can by using the output we previously computed.
Database Query Results Caching
In a scenario where the full-page output cache, the in-memory cache, and the node-local cache doesn’t have a valid entry for a given request, we need to reach all the way to the database. Once we get a result back from MySQL, we transparently cache the results in Redis for later retrieval based on the queries and their parameters. As long as the cache keys don’t change, running the same database queries over and over always hit Redis instead of reaching all the way to the database.
Liquid Object Memoizer
Thanks to the Liquid templating language, merchants and partners may build custom storefront themes. When loading a particular storefront page, it’s possible that the Liquid template to render includes multiple references to the same object. This is common on the product page for example, where the template will include many references to the product object: {{ product.title }}, {{ product.description }}, {{ product.featured_media }}, and others.
Of course, when each of these are executed, we don’t fetch the product over and over again from the database—we fetch it once, then keep it in memory for later use throughout the request lifecycle. This means that if the same product object is required multiple times at different locations during the render process, we’ll always use the same one and only instance of it throughout the entire request lifecycle.
The Liquid object memoizer is especially useful when multiple different Liquid objects end up loading the same resource. For example, when loading multiple product objects on a collection page using {{ collection.products }} and then referring to a particular product using {{ all_products[‘cowboy-hat’] }} on a collection page, with the Liquid object memoizer we’ll load it from an external data store once, then store it in memory and fetch it from there if it’s needed later. On average, across all Shopify storefronts, we see that the Liquid object memoizer prevents between 16 and 20 accesses to Redis and/or MySQL for every single storefront request, where we leverage the in-memory cache instead. In some extreme cases, we see that the memoizer prevents up to 4,000 calls to data stores per request.
Reducing Memory Allocations
Writing Memory-aware Code
Garbage collection execution is expensive. So we write code that doesn’t generate unnecessary objects. Use of methods and algorithms that modify objects in place, instead of generating a new object. For example:
use map! instead of map when dealing with lists. It prevents a new Array object from being created.
Use string interpolation instead of string concatenation. Interpolation does not create intermediate unnecessary String objects.
This may not seem like much, but consider this: using #map! instead of #map could reduce your memory usage significantly, even when simply looping over an array of integers to double the values.
Let’s set up an following array of 1000 integers from 1 to 1000:
array = (1..1000).to_a
Then, let’s double each number in the array with Array#map:
array.map { |i| i * 2 }
The line above leads to one object allocated in memory, for a total of 8040 bytes.
Now let’s do the same thing with Array#map! instead:
array.map! { |i| i * 2 }
The line above leads to zero object allocated in memory, for a total of 0 bytes.
Even with this tiny example, using map! instead of map saves ~8 kilobytes of allocated memory, and considering the sheer scale of the Shopify platform and the storefront traffic throughput it receives, every little bit of memory optimization counts to help the garbage collector run less often and for smaller periods of time, thus improving server response times.
With that in mind, we use tracing and profiling tools extensively to dive deeper into areas in the rendering engine that are consuming too much memory and to make precise changes to reduce memory usage.
Method-specific Memory Benchmarking
To prevent accidentally increasing memory allocations, we built a test helper method that lets us benchmark a method or a block to know many memory allocations and allocated bytes it triggers. Here’s how we use it:
This benchmark test will succeed if calling Product.find_by_handle('cowboy-hat') matches the following criteria:
The call allocates between 48 and 52 objects in memory;
The call allocates between 5100 and 5200 bytes in memory.
We allow a range of allocations because they’re not deterministic on every test run. This depends on the order in which tests run and the way data is cached, which can affect the final number of allocations.
As such, these memory benchmarks help us keep an eye on memory usage for specific methods. In practice, they’ve prevented introducing inefficient third-party gems that bloat memory usage, and they’ve increased awareness of memory usage to developers when working on features.
We covered three main ways to improve server-side performance: batching up calls to external data stores to reduce roundtrips, caching data in multiple layers for specific use cases, and simplifying the amount of work required to fulfill a task by reducing memory allocations. When they’re all combined, these approaches lead to big time performance gains for merchants on the platform—the average response time with the new rendering engine is 5x faster than with the previous implementation.
Those are just some of the techniques that we are using to make the new application faster. And we never stop exploring new ways to speed up merchant’s storefronts. Faster rendering times are in the DNA of our team!
- The Storefront Renderer Team
Celso Dantas is a Staff Developer on the Storefront Renderer team. He joined Shopify in 2013 and has worked on multiple projects since then. Lately specializing in making merchants storefront faster.
Maxime Vaillancourt is a Senior Developer on the Storefront Rendering team. He has been at Shopify for 3 years, starting on the Online Store Themes team, then specializing towards storefront performance with the storefront rendering engine rewrite.
Shipit! Presents: Performance Tips from the Storefront Renderer Team
The Storefront Renderer is a server-side application that loads a Shopify merchant's storefront Liquid theme, along with the data required to serve the request (for example product data, collection data, inventory information, and images), and returns the HTML response back to your browser. On average, server response times for the Storefront Renderer are four times faster than the implementation it replaced.
Our blog post, How Shopify Reduced Storefront Response Times with a Rewrite generated great discussions and questions. This event looks to answer those questions and dives deeper into the technical details of how we made the Storefront Renderer engine faster.
During this event you will learn how we:
optimized data access
implemented caching layers
reduced memory allocations
We're planning to DOUBLE our engineering team in 2021 by hiring 2,021 new technical roles (see what we did there?). Our platform handled record-breaking sales over BFCM and commerce isn't slowing down. Help us scale & make commerce better for everyone.
Shopify is an all-in-one commerce platform that serves over 1M+ merchants in approximately 175 countries across the world. Many of our merchants prepare months in advance for their biggest shopping season of the year, and they trust us to help them get through it successfully. As our merchants grow and their numbers increase, we must scale our platform without compromising on our stability, performance, and quality.
With Black Friday and Cyber Monday (BFCM) being the two biggest shopping events of the year and with other events on the horizon, there is a lot of preparation that Shopify needs to do on our platform. This effort needs a key driver to set expectations for many teams and hold them accountable to complete the work for their area in the platform.
Lisa Vanderschuit getting hyped about making commerce better for everyone
I’m an Engineering Program Manager (EPM) with a focus on platform quality and was one of the main program managers (PgM) tapped midway in the year to drive these efforts. For this initiative I worked with three Production Engineering leads (BFCM leads) and three other program managers (with a respective focus in resiliency, scale, and capacity) to:
understand opportunities for improvement
build out a program that’s effective at scale
create adjustments to the workflow specifically for BFCM
execute the program
start iterating on the program for next year.
Understanding our Opportunities
Each year, the BFCM leads start a large cross company push to get the platform ready for BFCM. They ask the teams responsible for critical areas of the platform to complete the following prep:
focus on addressing the deprioritized maintenance from earlier in the year
Looking at the past years, the BFCM leads chosen to champion this in spend a significant time on administrative, communication, and reporting activities when their time is better spent in the weeds of the problems. Our PgM group was assigned to take on these responsibilities so that these leads could focus on investigating the technical challenges and escalations.
Before jumping into solutions, our PgM group looked into the past to find lessons to inform the future. In looking at past retrospective documents we found some common themes over the years that we needed to keep in mind as we put together our plan:
Shopify needs to prepare in advance for supporting large merchants with lots of popular inventory to sell.
Scaling trends weren’t just on the two main days. Sales were spreading out through the week, and there were pre sale and post sale workflows where we needed to be well tested for how much load we could sustain without performance issues.
There were some parts of the platform tied to disruptions in the past that would require additional load testing to give us more confidence in their stability.
With Shopify moving to Digital by Default and the increasing number of timezones to consider, there were more complexities to getting the company aligned to the same goals and schedule. Our PgM group wanted to create structure around coordinating a large scale effort, but we also wanted to start thinking about how maintenance and prep work can be done throughout the year, so we’re ready for any large shopping event regardless of the time of year.
Building the Program Plan
Our PgM group listed all the platform preparation tasks the BFCM leads asked developers to do in the past. Then we highlighted items that had to happen this year and took note of when they needed to happen. After this, we asked the BFCM leads to highlight the important things critical for their participation and then we assigned the rest of the work for our PgM group to manage.
Example of our communication plan calendar
Once we had those details documented, we created a communication plan calendar (a.k.a spreadsheet) to see what was next, week over week. We split the PgM work into workstreams then we each selected ones respective to our areas of focus. In my workstream I had two main responsibilities:
Put together a plan to get people assigned to do the platform preparation work that the BFCM leads wanted them to.
Determine what kind of PRs should or should not be shipped to production in the month before and after BFCM.
For platform preparation work listed earlier, I asked teams to identify which areas of the platform that need prepping for the large shopping event. Even with a reduced set of areas to focus on there were still quite a bit of people that I would need to get this prep work assigned to. Instead of working directly with every single person, I used a distributed ownership model. I asked each GM or VP with critical areas to assign a champion from their department to work with. Then I reached out to the champions to let them know of the prep work that needed to be done. They then either assigned the work themselves or they assigned people from their team. To keep track of this ownership I built a tracking spreadsheet and set up a schedule to report on progress week over week.
In the past, our Deploys team would lock the ability to automatically deploy to production for a week. Since BFCM is becoming more spread out year after year, we realized we needed to adjust our culture around shipping in the last two months of the year to make sure we could confidently provide merchants with a resilient platform. Merchants were also needing to train up staff further in advance of the year so we also had to consider slowing down new features that could require extra training for their staff. To start tackling these challenges I asked:
Teams to take inventory of all of our platform areas and highlight which areas were considered critical for the merchant experience.
That we set up a rule in a bot we call Caution Tape to comment a thorough risk to value assessment on any new PRs created between November to December in repos that had been flagged as critical to successful large shopping events.
If the PRs were proposing a merchant facing feature the Caution Tape bot message asked that they document the risks vs the value to shipping around BFCM and that they only ship if approved by a director or GM in their area. In many cases the people creating these PRs either investigated a safer approach, got more thorough reviews, or decided to wait until next year to launch the feature.
On the week of Black Friday 60% of the work in GitHub was code reviews
To artificially slow down the rate of items being shipped to production we planned to reduce the amount of PRs that could be shipped in a deploy and increase the amount of time they would spend in canaries (pre-production deploy test). On top of this we also planned to lock deploys for a week around the BFCM weekend.
Executing the Program
How do you rally 2500+ people around a mission who are responsible for 1000+ deploys across all services? You state your expectations and then repeat many times in different ways.
1. Our PGM and BFCM lead group had two main communication options where we started engagement with the rest of the engineering group working on platform prep:
Shared Slack channels for discussions, questions, and updates.
GitHub repos for assigning work.
2. Our PGM group put together and shared internal documentation on the program details to make it easier to onboard participants to the program.
3. Our PGM group shared high-level announcements, reminders and presentations throughout the year, increasing in frequency leading up to BFCM, to increase awareness and engagement. Some examples of this were:
progress reports on each department posted in Slack.
live-Streamed and recorded presentations on our internal broadcasting channel to inform the company about our mission and where to go for help.
emails sent to targeted groups to remind people of their respective responsibilities and deadlines.
GitHub issues created and assigned to teams with a checklist of the prep work we had asked them to do.
To make sure our BFCM leads had the support they needed our PgM group had regular check-in meetings with them to get a pulse on how they were feeling things were going. To make sure our PgM group was on top of the allocated tasks each week we had meetings at the start and end of each week. Then we hosted office hours along with the BFCM leads for any developers that wanted facetime to flag any potential concerns about their area.
Celebrations and Lessons Learned
Overall I’d say our program was a success. We had a very successful BFCM with sales of $5.1+ billion from the more than one million Shopify-powered brands around the world. We found that our predictions for which areas would take the most load were on target and that the load testing and spinning up of resources paid off.
Celebrating BFCM
From our internal developer view we had success in the sense that shipping to the platform didn’t need to come to a full stop. PR reviews were at an all time high which meant that developers focus on quality was at an all time high. For the areas where we did have to slow down on shipping code for features we found that our developers had more time to work on the other important aspects of work that needs to be done in engineering. Teams were able to
focus more on clean up tasks
write blog posts
put together strategic roadmaps and architecture design docs
plan team building exercises.
Overall we still did take a hit in developer productivity and we could have been a bit more relaxed on how long we enforced the extra risk to value assessment on our PRs and expectations on deploying to production. Our PGM team hopes to find a more balanced approach for this for next year's plan.
From a communication standpoint, some of the messaging to developers was inconsistent on whether or not they could ship to critical areas of the platform during November and December. Our PGM group also ended up putting together some of the announcement drafts last minute so in future years we want to have this included in our communication plan from the start with templates ready to go.
Our PGM group is hoping to have a retrospective meeting later this year with the BFCM leads to see how we can adjust the program plan for next year. We will be taking everything we learned and find opportunities where we can automate some of the work or distribute the work throughout the year so we can be always ready for any large shopping event in the year.
If you have a large initiative at your company, consider creating a role for people technical enough to be dangerous that can help drive engineering initiatives forward and work with your top developers to maximise their time and expertise to solve the big complex problems and get shit done.
Lisa Vanderschuit is an Engineering Program Manager who manages the engineering theme of Code Quality. She has been at Shopify for 6 years, working on areas from editing and reviewing Online Store themes to helping our engineering teams raise the bar of code quality at Shopify.
How does your team leverage program managers at your company? What advice do you have for coordinating cross company engineering initiatives? We want to hear from you on Twitter at @ShopifyEng.
We're planning to DOUBLE our engineering team in 2021 by hiring 2,021 new technical roles (see what we did there?). Our platform handled record-breaking sales over BFCM and commerce isn't slowing down. Help us scale & make commerce better for everyone.
2020 Black Friday Cyber Monday (BFCM) is over, and another BFCM Globe has shipped. We’re extremely proud of the globe, it focused on realism, performance, and the impact our merchants have on the world.
The Black Friday Cyber Monday Live Map
We knew we had a tall task in front of us this year, building something that could represent orders from our one million merchants in just two months. Not only that, we wanted to ship a data visualization for our merchants so they could have a similar experience to the BFCM globe every day in their Live View.
Prototypes for the 2020 BFCM Globe and Live View. **
With tight timelines and an ambitious initiative, we immediately jumped into prototypes with three.js and planned our architecture.
Working with a Layer Architecture
As we planned this project, we converged architecturally on the idea of layers. Each layer is similar to a React component where state is minimally shared with the rest of the application, and each layer encapsulates its own functionality. This allowed for code reuse and flexibility to build both the Live View Globe, BFCM Globe, and beyond.
A showcase of layers for the 2020 BFCM Globe. **
When realism is key, it’s always best to lean on fantastic artists, and that’s where Byron Delgado came in. We hoped that Byron would be able to use the 3D modeling tools he’s used to, and then we would incorporate his 3D models into our experience. This is where the EarthRealistic layer comes in.
EarthRealistic layer from the 2020 BFCM Globe. **
EarthRealistic uses a technique called physically based rendering, which most modern 3D modeling software supports. In three.js, physically based rendering is implemented via the MeshPhysicalMaterial or MeshStandardMaterial materials.
To achieve realistic lighting, EarthRealistic is lit by a 32bit EXR Environment Map. By using a 32bit EXR, it means we can have smooth image based lighting. Image based lighting is a technique where a “360 sphere” is created around the 3D scene, and pixels in that image are used to calculate how bright Triangles on 3D models should be. This allows for complex lighting setups without much effort from an artist. Traditionally images on the web such as JPGs and PNGs have a color depth of 8bits. If we were to use these formats and 8bit color depth, our globe lighting would have had horrible gradient banding, missing realism entirely.
Rendering and Lighting the Carbon Offset Visualization
Once we converged on physically based rendering and image based lighting, building the carbon offset layer became clearer. Literally!
Carbon Offset visualization layer from the 2020 BFCM Globe. **
Bubbles have an interesting phenomenon where they can be almost opaque at a certain angle and light intensity but in other areas completely transparent. To achieve this look, we created a custom material based on MeshStandardMaterial that reads in an Environment Map and simulates the bubble lighting phenomenon. The following is the easiest way to achieve this with three.js:
Create a custom Material class that extends off of MeshStandardMaterial.
Write a custom Vertex or Fragment Shader and define any Uniforms for that Shader Program.
Override onBeforeCompile(shader: Shader, _renderer: WebGLRenderer): void on your custom Material and pass the custom Vertex or Fragment Shader and uniforms via the Shader instance.
Here’s our implementation of the above for the Carbon Offset Shield Material:
shield.frag - Custom Fragment shaders that make MeshStandardMaterial look like a bubble
Let’s look at the above, starting with our Fragment shader. In shield.frag lines 94-97
These two lines are all that are needed to achieve a bubble effect in a fragment shader.
To calculate the brightness of an rgb pixel, you calculate the length or magnitude of the pixel using the GLSL length function. In three.js shaders, outgoingLight is an RGB vec3 representing the outgoing light or pixel to be rendered.
If you remember from earlier, the bubble’s brightness determines how transparent or opaque it should appear. After calculating brightness, we can set the outgoing pixel’s alpha based on the brightness calculation. Here we use the GLSL mix function to go between the expected alpha of the pixel defined by diffuseColor.a and a new custom uniform defined as maxOpacity. By having the concept of min or expected opacity and max opacity, Byron and other artists can tweak visuals to their exact liking.
If you look at our shield.frag file, it may seem daunting! What on earth is all of this code? three.js materials handle a lot of functionality, so it’s best to make small additions and not modify existing code. three.js materials all have their own shaders defined in the ShaderLib folder. To extend a three.js material, you can grab the original material shader code from the src/renderers/shaders/ShaderLib/ folder in the three.js repo and perform any custom calculations before setting gl_FragColor. An easier option to access three.js shader code is to simply console.log the shader.fragmentShader or shader.vertexShader strings, which are exposed in the onBeforeCompile function:
onBeforeCompile runs immediately before the Shader Program is created on the GPU. Here you can override shaders and uniforms. CustomMeshStandardMaterial.ts is an abstraction we wrote to make creating custom materials easier. It overrides the onBeforeCompile function and manages uniforms while your application runs via the setCustomUniform and getCustomUniform functions. You can see this in action in our custom Shield Material when getting and setting maxOpacity:
Using Particles to Display Orders
Displaying orders on Shopify from across the world using particles. **
One of the BFCM globe’s main features is the ability to view orders happening in real-time from our merchants and their buyers worldwide. Given Shopify’s scale and amount of orders happening during BFCM, it’s challenging to visually represent all of the orders happening at any given time. We wanted to find a way to showcase the sheer volume of orders our merchants receive over this time in both a visually compelling and performant way.
In the past, we used visual “arcs” to display the connection between a buyer’s and a merchant’s location.
The BFCM Globe from 2018 showing orders using visual arcs.
With thousands of orders happening every minute, using arcs alone to represent every order quickly became a visual mess along with a heavy decrease in framerate. One solution was to cap the number of arcs we display, but this would only allow us to display a small fraction of the orders we were processing. Instead, we investigated using a particle-based solution to help fill the gap.
With particles, we wanted to see if we could:
Handle thousands of orders at any given time on screen.
Maintain 60 frames per second on low-end devices.
Have the ability to customize style and animations per order, such as visualizing local and international orders.
From the start, we figured that rendering geometry per an order wouldn't scale well if we wanted to have thousands of orders on screen. Particles appear on the globe as highlights, so they don’t necessarily need to have a 3D perspective. Rather than using triangles for each particle, we began our investigation using three.js Points as a start, which allowed us to draw using dots instead. Next, we needed an efficient way to store data for each particle we wanted to render. Using BufferGeometry, we assigned custom attributes that contained all the information we needed for each particle/order.
To render the points and make use of our attributes, we created a ShaderMaterial, and custom vertex and fragment shaders. Most of the magic for rendering and animating the particles happens inside the vertex shader. Each particle defined in the attributes we pass to our BufferGeometry goes through a series of steps and transformations.
First, each particle has a starting and ending location described using latitude and longitude. Since we want the particle to travel along the surface and not through it, we use a geo interpolation function on our coordinates to find a path that goes along the surface.
An order represented as a particle traveling from New York City to London. The vertex shader uses each location’s latitude and longitude and determines the path it needs to travel. **
Next, to give the particle height along its path, we use high school geometry, a parabola equation based on time to alter the straight path to a curve.
Particles follow a curved path away from the earth’s surface using a parabola equation to determine its height. **
To render the particle to make it look 3D in its travels, we combine our height and projected path data then convert it to a vector position our shader uses as it’s gl_Position. With our particle now knowing where it needs to go, using a time uniform, we drive animations for other changes such as size and color. At the end of the vertex shader, we pass the position and point size to render onto the fragment shader that combines the calculated color and alpha at the time for each particle.
Once the vertex shader is complete, the vertex shader passes position and point size onto the fragment shader that combines the animated color and alpha for each particle.
Given that we wanted to support updating and animating thousands of particles at any moment, we wanted to be careful about how we access and update our attributes. For example, if we had 10000 particles in transit, we need to continue updating those and other data points that are coming in. Instead of updating all of our attributes every time, which can be processor-intensive, we made use of BufferAttribute’s updateRange to update a subset of the attributes we needed to change on each frame instead of the entire attribute set.
gl_Points enables us to render 150,000 particles flying around the globe at any given time without performance issues. **
Combining all of the above, we saw upwards of 150,000 particles animating to and from locations on the globe without noticing any performance degradation.
Optimizing Performance
In video games, you may have seen settings for different quality levels. These settings modify the render quality of the application. Most modern games will automatically scale performance. Most aggressively, the application may reduce texture quality or how many vertices are rendered per 3D object.
With the amount of development time we had for this project, we simply didn’t have time to be this aggressive. Yet, we still had to support old, low-power devices such as dated mobile phones. Here’s how we implemented an auto optimizer that could increase an iPhone 7+ render performance from 40 frames per second (fps) to a cool 60fps.
If your application isn’t performing well, you might see a graph like this:
Graph depicting the Globe application running at 40 frames per second on a low power device
Ideally, in modern applications, your application should be running at 60fps or more. You can also use this metric to determine when you should lower the quality of your application. Our initial implementation plan was to keep it simple and make every device with a low-resolution display run in low quality. However, this would mean new phones with low-resolution displays and extremely capable GPUs would receive a low-quality experience. Our final attempt monitors fps. If it’s lower than 55fps for over 2 seconds, we decrease the application’s quality. This adjustment allows phones such as the new iPhone 12 Pro Max to run in the highest quality possible while an iPhone 7+ can render at lower quality but consistent high framerate. Decreasing the quality of an application by reducing buffer sizes is optimal. However, in our aggressive timeline, this would have created many bugs and overall application instability.
Left side of the image depicts the application running in High-Quality mode, where the right side of the image depicts the application running in Low-Quality mode. **
What we opted for instead was simple and likely more effective. When our application retains a low frame rate, we simply reduce the size of the <canvas> HTML element, which means we’re rendering fewer pixels. After this, WebGL has to do far less work, in most cases, 2x or 3x less work. When our WebGLRenderer is created, we setPixelRatio based on window.devicePixelRatio. When we’ve retained a low frame rate, we simply drop the canvas pixel ratio back down to 1x. The visual differences are nominal and mainly noticeable in edge aliasing. This technique is simple but effective. We also reduce the resolution of our Environment Maps generated by PMREMGenerator, but most applications will be able to utilize the devicePixelRatio drop more effectively.
If you’re curious, this is what our graph looks like after the Auto Optimizer kicks in (red circled area)
Graph depicting the Globe application running at 60 frames per second on a low power device with a circle indicating when the application quality was reduced
Globe 2021
We hope you enjoyed this behind the scenes look at the 2020 BFCM Globe and learned some tips and tricks along the way. We believe that by shipping two globes in a short amount of time, we were able to focus on the things that mattered most while still keeping a high degree of quality. However, the best part of all of this is that our globe implementation now lives on as a library internally that we can use to ship future globes. Onward to 2021!
*All data is unaudited and is subject to adjustment. **Made with Natural Earth; textures from Visible Earth NASA
Mikko Haapoja is a development manager from Toronto. At Shopify he focuses on 3D, Augmented Reality, and Virtual Reality. On a sunny day if you’re in the beaches area you might see him flying around on his OneWheel or paddleboarding on the lake.
Stephan Leroux is a Staff Developer on Shopify's AR/VR team investigating the intersection of commerce and 3D. He has been at Shopify for 3 years working on bringing 3D experiences to the platform through product and prototypes.
We're planning to DOUBLE our engineering team in 2021 by hiring 2,021 new technical roles (see what we did there?). Our platform handled record-breaking sales over BFCM, and commerce isn't slowing down. Help us scale & make commerce better for everyone.
Databases are a key scalability bottleneck for many web applications. But what if you could make a small change to your database design that would unlock massively more efficient data access? At Shopify, we dusted off some old database principles and did exactly that with the primary Rails application that powers online stores for over a million merchants. In this post, we’ll walk you through how we did it, and how you can use the same trick to optimize your own applications.
Background
A basic principle of database design is that data that is accessed together should be stored together. In a relational database, we see this principle at work in the design of individual records (rows), which are composed of bits of information that are often accessed and stored at the same time. When a query needs to access or update multiple records, this query will be faster if those rows are “near” to each other. In MySQL, the sequential ordering of rows on disk is dictated by the table’s primary key.
Active Record is the portion of the Rails application framework that abstracts and simplifies database access. This layer introduces database practices and conventions that greatly simplify application development. One such convention is that all tables have a simple automatically incrementing integer primary key, often called `id`. This means that, for a typical Rails application, most data is stored on disk strictly in the order the rows were created. For most tables in most Rails applications, this works just fine and is easy for application developers to understand.
Sometimes the pattern of row access in a table is quite different from the insertion pattern. In the case of Shopify’s core API server, it is usually quite different, due to Shopify’s multi-tenant architecture. Each database instance contains records from many shops. With a simple auto-incrementing primary key, table insertions interleave the insertion of records across many shops. On the other hand, most queries are only interested in the records for a single shop at a time.
Let’s take a look at how this plays out at the database storage level. We will use details from MySQL using the InnoDB storage engine, but the basic idea will hold true across many relational databases. Records are stored on disk in a data structure called a B+ tree. Here is an illustration of a table storing orders, with the integer order id shown, color-coded by shop:
Individual records are grouped into pages. When a record is queried, the entire page is loaded from disk into an in-memory structure called a buffer pool. Subsequent reads from the same page are much faster while it remains in the buffer pool. As we can see in the example above, if we want to retrieve all orders from the “yellow” shop, every page will need loading from disk. This is the worst-case scenario, but it turned out to be a prevalent scenario in Shopify’s main operational database. For some of our most important queries, we observed an average of 0.9 pages read per row in the final query result. This means we were loading an entire page into memory for nearly every row of data that we needed!
The fix for this problem is conceptually very simple. Instead of a simple primary key, we create a composite primary key [shop_id, order_id]. With this key structure, our disk layout looks quite different:
Records are now grouped into pages by shop. When retrieving orders for the “yellow” shop, we read from a much smaller set of pages (in this example it’s only one page less, but imagine extrapolating this to a table storing records for 10,000 shops and the result is more profound).
So far, so good. We have an obvious problem with the efficiency of data access and a simple solution. For the remainder of this article, we’ll go through some of the implementation details and challenges we came across with rolling out composite primary keys in our main operational database, along with the impact for our Ruby on Rails application and other systems directly coupled to our database. We will continue using the example of an “orders” table, both because it is conceptually simple to understand. It also turned out to be one of the critical table names that we applied this change to.
Introducing Composite Primary Keys
The first challenge we faced with introducing composite primary keys was at the application layer. Our framework and application code contained various assumptions about the table’s primary key. Active Record, in particular, assumes an integer primary key, and although there is a community gem to monkey-patch this, we didn’t have confidence that this approach would be sustainable and maintainable in the future. On deeper analysis, it turned out that nearly all such assumptions in application layer code continued to hold if we changed the `id` column to be an auto-incrementing secondary key. We can leave the application layer blissfully unaware of the underlying database schema by forcing Active Record to treat the `id` column as a primary key:
class Order < ApplicationRecord
  self.primary_key = :id
  .. remainder of order model ...
end
Here is the corresponding SQL table definition:
CREATE TABLE `orders` (
  `id` bigint(20) NOT NULL AUTO_INCREMENT,
  `shop_id` bigint(20) NOT NULL,
  … other columns ...
  PRIMARY KEY (`shop_id`,`id`),
  KEY `id` (`id`)
  … other secondary keys ...
)
Note that we chose to leave the secondary index as a non-unique key here. There is some risk to this approach because it is possible to construct application code that results in duplicate models with the same id (but with different shop_id in our case). You can opt for safety here and make a unique secondary key on id. We took this approach because the method we use for live schema migrations is prone to deadlock on tables containing multiple unique constraints. Specifically, we use Large Hadron Migrator (LHM), which uses MySQL triggers to copy records into a shadow table during migrations. Unique constraints are enforced in InnoDB through an exclusive table-level write lock. Since there are two tables accepting writes, each containing two exclusive locks, all of the necessary deadlock conditions are present during migration. You may be able to keep a unique constraint on `id` if any of the following are true:
You don’t perform live migrations on your application.
Your migrations don’t use SQL triggers (such as the default Rails migrations).
The write throughput on the table is low enough that a low volume of deadlocks is acceptable for your application.
The code path for writing to this table is resilient to database transaction failures.
The remaining area of concern is any data infrastructure that directly accesses the MySQL database outside of the Rails application layer. In our case, we had three key technologies that fell into this category:
Our live data migration system, called Ghostferry. Ghostferry moves data across different MySQL instances while the application is still running, enabling load-balancing of sharded data across multiple databases. We implemented support for composite primary keys in ghostferry as part of this work, by introducing the ability to specify an alternate column for pagination during migration.
Our data warehousing system does both bulk and incremental extraction of MySQL tables into long term storage. Since this system is proprietary to Shopify we won’t cover this area further, but if you have a similar data extraction system, you’ll need to ensure it can accommodate tables with composite primary keys.
Results
Before we dig into specific results, a disclaimer: every table and corresponding application code is different, so the results you see in one table do not necessarily translate into another. You need to carefully consider your data’s access patterns to ensure that the primary key structure produces the optimal clustering for those access patterns. In our case of a sharded application, clustering the data by shop was often the right answer. However, if you have multiple closely connected data models, you may find another structure works better. To use a common example, if an application has “Blog” and “BlogPost” models, a suitable primary key for the blog_posts table may be (blog_id, blog_post_id). This is because typical data access patterns will tend to query posts for a single blog at once. In some cases, we found no overwhelming advantage to a composite primary key because there was no such singular data access pattern to optimize for. In one more subtle example, we found that associated records tended to be written within the same transaction, and so were already sequentially ordered, eliminating the advantage of a composite key. To extend the previous blog example, imagine if all posts for a single blog were always created in a single transaction, so that blog post records were never interleaved with insertion of posts from other blogs.
Returning to our leading example of an “orders” table, we measured a significant improvement in database efficiency:
The most common queries that consumed most database capacity had a 5-6x improvement in elapsed query time.
Performance gains corresponded linearly with a reduction in MySQL buffer pool page reads per query. Adding a composite key on our single most queried table reduced the median buffer pool reads per query from 1.8 to 1.2.
There was a dramatic improvement in tail latency for our slowest queries. We maintain a log of slow queries, which showed a roughly 80% reduction in distinct queries relating to the orders table.
Performance gains varied greatly across different kinds of queries. The most dramatic improvement was 500x on a particularly egregious query. Most queries involving joins saw much lower improvement due to the lack of similar data clustering in other tables (we expect this to improve as more tables adopt composite keys).
A useful measure of aggregate improvement is to measure the total elapsed database time per day, across all queries involving the changed table. This helps to add up the net benefit on database capacity across the system. We observed a reduction of roughly one hour per day, per shard, in elapsed query time from this change.
There is one notable downside on performance that is worth clearly calling out. A simple auto-incrementing primary key has optimal performance on insert statements because data is always clustered in insertion order. Changing to a composite primary key results in more expensive inserts, as more distinct database pages need to be both read and flushed to disk. We observed a roughly 10x performance degradation on inserts by changing to a composite primary key. Most data are queried and updated far more often than inserted, so this tradeoff is correct in most cases. However, it is worth keeping this in mind if insert performance is a critical bottleneck in your system for the table in question.
Wrapping Up
The benefits of data clustering and the use of composite primary keys are well-established techniques in the database world. Within the Rails ecosystem, established conventions around primary keys mean that many Rails applications lose out on these benefits. If you are operating a large Rails application, and either database performance or capacity are major concerns, it is worth exploring a move to composite primary keys in some of your tables. In our case, we faced a large upfront cost to introduce composite primary keys due to the complexity of our data infrastructure, but with that cost paid, we can now introduce additional composite keys with a small incremental effort. This has resulted in significant improvements to query performance and total database capacity in one of the world’s largest and oldest Rails applications.
Wherever you are, your next journey starts here! If building systems from the ground up to solve real-world problems interests you? Visit our Engineering career page to find out about our open positions and learn about Digital by Default.
Editor's note: These ideas were also presented live and the video is available. If you find this useful, stay updated by following me on Twitter or my blog.
There’s always new stuff: new frameworks, new languages, and new platforms. All of this adds up. Sometimes it feels like you’re just treading water, and not actually getting better at what you do. I’ve tried spending more time learning this stuff, but that doesn’t work—there’s always more. I have found a better approach is learning things at a deeper level and using those lessons as a checklist. This checklist of core principles are called mental models.
I learned this approach by studying how bright people think. You might have heard Richard Feynman describe the handful of algorithms that he applies to everything. Maybe you’ve seen Elon Musk describe his approach as thinking by fundamental principles. Charlie Munger also credits most of his financial success to mental models. All of these people are amazing and you won’t get to their level with mental models alone, but mental models give you a nudge in the right direction.
So, how does one integrate mental models into their life and work? The first thing that you need is a method for prioritizing new concepts that you should learn. After that, you’ll need a good system for keeping track of what you have identified as important. With this process, you’ll identify mental models and use them to make more informed decisions. Below I start by describing some engineering and management mental models that I have found useful over the years.
When something breaks you should hear about it. This is important because small issues can help you find larger structural issues. Silent failures typically happen when exceptions are silenced—this may be in a networking library, or the code that handles exceptions. Failures can also be silent when one of your servers is down. You can prevent this by using a third party system that pings each of the critical components.
As your project gets more mature, set up a dashboard to track key metrics and create automated alerts. Generally, computers should tell you when something is wrong. Systems become more difficult to monitor as they grow. You want to measure and log everything at the beginning and not wait until something goes wrong. You can encourage other developers to do this by creating helper classes with a really simple APIs since things that are easy and obvious are more likely to be used. Once you are logging everything, create automated alerts. Post these alerts in shared communication channels, and automatically page the oncall developer for emergencies.
Do Minimal Upfront Work and Queue the Rest
A system is scalable when it handles unexpectedly large bursts of incoming requests. The faster your system handles a request, the faster it gets to the next one. Turns out, that in most cases, you don’t have to give a response to the request right away—just a response indicating you've started working on the task. In practice, you queue a background job after you receive a request. Once your job is in a queue, you have the added benefit of making your system fault tolerant since failed jobs can be tried again.
Scaling Reads with Caching and Denormalizing
Read-heavy systems mean some data is being read multiple times. This can be problematic because your database might not have enough capacity to deal with all of that work. The general approach of solving this is by pre-computing this data (called denormalizing) and storing it somewhere fast. In practice, instead of letting each request hit multiple tables in a database, you pre-compute the expected response and store it in a single place. Ideally, you store this information somewhere that’s really fast to read from (think RAM). In practice this means storing data in data stores like Memcached.
Scaling Writes with Sharding or Design Choices
Write-heavy systems tend to be difficult to deal with. Traditional relational databases can handle reads pretty well, but have trouble with writes. They take more time processing writes because relational databases spend more effort on durability and that can lock up writes and create timeout errors.
Consider the scenario where a relational database is at it’s write-capacity and you can’t scale up anymore. One solution is to write data to multiple databases. Sharding is the process where you split your database into multiple parts (known as shards). This process allows you to group related data into one database. Another method of dealing with a write heavy system is by writing to Non-relational (NoSQL) databases. These databases are optimized to handle writes, but there’s a tradeoff. Depending on the type of NoSQL database and its configuration, it gives up:
atomic transactions (they don’t wait for other transactions to fully finish),
consistency across multiple clusters (they don’t wait for other clusters to have the same data),
durability (they don’t spend time writing to disk).
It may seem like you are giving up a lot, but you mitigate some of these losses with design choices.
Design choices help you cover some of the weaknesses of SQL databases. For example, consider that updating rows is much more expensive than creating new rows. Design your system so you avoid updating the same row in multiple flows—insert new rows to avoid lock contention. With all of that said, I recommend starting out with a SQL database, and evolving your setup depending on your needs.
Horizontal Scaling Is the Only Real Long Term Solution
Horizontal scaling refers to running your software on multiple small machines, while vertical scaling refers to running your software on one large machine. Horizontal scaling is more fault tolerant since failure of a machine doesn’t mean an outage. Instead, the work for the failed machine is routed to the other machines. In practice, horizontally scaling a system is the only long term approach to scaling. All systems that appear ‘infinitely-scalable’ are horizontally scaled under the hood: Cloud object stores like S3 and GCS; NoSQL databases like Bigtable and Dynamo DB; and stream processing systems like Kafka are all horizontally scaled. The cost for horizontally scaling systems is application and operational complexity. It takes significant time and potential complexity to horizontally scale your system, but you want to be in a situation where you can linearly scale your system by adding more computers.
Things That are Harder to Test Are More Likely to Break
Among competing approaches to a problem, you should pick the most testable solution (this is my variant of Occam’s Razor). If something is difficult to test, people tend to avoid testing it. This means that future programmers (or you) will be less likely to fully test this system, and each change will make the system more brittle. This model is important to remember when you first tackle a problem because good testability needs to be baked into the architecture. You’ll know when something is hard to test because your intuition will tell you.
Antifragility and Root Cause Analysis
Nassim Taleb uses the analogy of a hydra in Antifragile; they grow back a stronger head every time they are struck. The software industry championed this idea too. Instead of treating failures as shameful incidents that should be avoided at all costs, they’re now treated as opportunities to improve the system. Netflix’s engineering team is known for Chaos Monkey, a resiliency system that turns off random components. Once you anticipate random events, you can build a more resilient system. When failures do happen, they’re treated as an opportunity to learn.
Root cause analysis is a process where the people involved in a failure try to extract the root cause in a blameless way by starting off by what went right, and then diving into the failure without blaming anyone.
Big-O and Exponential Growth
The Big-O notation describes the growth in complexity of an algorithm. There’s a lot to this, but you’ll get very far if you just understand the difference between constant, linear, and exponential growth. In layman’s terms, algorithms that perform one task are better than algorithms that perform many tasks, and algorithms that perform many tasks are better than ones where the tasks are ever increasing with each iteration. I have found this issue visible at an architectural level as well.
Margin of Safety
Accounting for a margin of safety means you need to leave some room for errors or exceptional events. For example, you might be tempted to run each server at 90% of its capacity. While this saves money, it leaves your server vulnerable to spikes in traffic. You’ll have more confidence in your setup, if you have auto-scaling setup. There’s a problem with this too, your overworked server can cause cascading failures in the whole system. By the time auto-scaling kicks in, the new server may have a disk, connection pool or an assortment of other random fun issues. Expect the unexpected and give yourself some room to breathe. Margin of safety also applies to planning releases of new software. You should add a buffer of time because unexpected things will come up.
Protect the Public API
Be very careful when making changes to the public API. Once something is in the public API, it’s difficult to change or remove. In practice, this means having a very good reason for your changes, and being extremely careful with anything that affects external developers; mistakes in this type of work affect numerous people and are very difficult to revert.
Redundancy
Any system with many moving parts should be built to expect failures of individual parts. This means having backup providers for systems like Memcached or Redis. For permanent data-stores like SQL, fail-overs and backups are critical. Keep in mind that you shouldn’t consider something a backup unless you do regular drills to make sure that you can actually recover that data.
Loose Coupling and Isolation
Tight coupling means that different components of a system are closely interconnected. This has two major drawbacks. The first drawback is that these tightly coupled systems are more complex. Complex systems, in turn, are more difficult to maintain and more error prone. The second major drawback is that failure in one component propagates faster. When systems are loosely coupled, failures can be self contained and can be replaced by potential backups (see Redundancy). At a code level, reducing tight coupling means following the single responsibility principle which states that every class has a single responsibility and communicates with other classes with a minimal public API. At an architecture level, you improve tightly coupled systems by following the service oriented architecture. This architecture system suggests dividing components by their business services and only allows communication between these services with a strict API.
Be Serious About Configuration
Most failures in well-tested systems occur due to bad configuration; this can be changes like environmental variables updates or DNS settings. Configuration changes are particularly error prone because of the lack of tests and the difference between the development and production environment. In practice, add tests to cover different configurations, and make the dev and prod environment as similar as possible. If something works in development, but not production, spend some time thinking about why that’s the case.
Explicit Is Better than Implicit
The explicit is better than implicit model is one of the core tenants from the Zen of Python and it’s critical to improving code readability. It’s difficult to understand code that expects the reader to have all of the context of the original author. An engineer should be able to look at class and understand where all of the different components come from. I have found that simply having everything in one place is better than convoluted design patterns. Write code for people, not computers.
Code Review
Code review is one of the highest leverage activities a developer can perform. It improves code quality and transfers knowledge between developers. Great code reviewers change the culture and performance of an entire engineering organization. Have at least two other developers review your code before shipping it. Reviewers should give thorough feedback all at once, as it’s really inefficient to have multiple rounds of reviews. You’ll find that your code review quality will slip depending on your energy level. Here’s an approach to getting some consistency in reviews:
Why is this change being made?
How can this approach or code be wrong?
Do the tests cover this or do I need to run it locally?
Perceived Performance
Based on UX research, 0.1 second (100 ms) is the gold standard of loading time. Slower applications risk losing the user’s attention. Accomplishing this load time for non-trivial apps is actually pretty difficult, so this is where you can take advantage of perceived performance. Perceived performance refers to how fast your product feels. The idea is that you show users placeholder content at load time and then add the actual content on the screen once it finishes loading. This is related to the Do Minimal Upfront Work and Queue the Rest model.
Never Trust User Input Without Validating it First
The internet works because we managed to create predictable and secure abstractions on top of unpredictable and insecure networks of computers. These abstractions are mostly invisible to users but there’s a lot happening in the background to make it work. As an engineer, you should be mindful of this and never trust input without validating it first. There are a few fundamental issues when receiving input from the user.
You need to validate that the user is who they say they are (authentication).
You need to ensure that the communication channel is secure, and no one else is snooping (confidentiality).
You need to validate that the incoming data was not manipulated in the network (data integrity).
You need to prevent replay attacks and ensure that the same data isn’t being sent multiple times.
You could also have the case where a trusted entity is sending malicious data.
This is simplified, and there are more things that can go wrong, so you should always validate user input before trusting it.
Safety Valves
Building a system means accounting for all possibilities. In addition to worst case scenarios, you have to be prepared to deal with things that you cannot anticipate. The general approach for handling these scenarios is stopping the system to prevent any possible damage. In practice, this means having controls that let you reject additional requests while you diagnose a solution. One way to do this is adding an environment variable that can be toggled without deploying a new version of your code.
Automatic Cache Expiration
Your caching setup can be greatly simplified with automatic cache expiration. To illustrate why, consider the example where the server is rendering a product on a page. You want to expire the cache whenever this product changes. The manual method is by expiring the cache expiration code after the product is changed. This requires two separate steps, 1) Changing the product, and then 2) Expiring the cache. If you build your system with key-based caching, you avoid the second step all together. It’s typically done by using a combination of the product’s ID and it’s last_updated_at_timestamp as the key for the product’s cache. This means that when a product changes it’ll have a different last_updated_at_timestamp field. Since you’ll have a different key, you won’t find anything in the cache matching that key and fetch the product in it’s newest state. The downside of this approach is that your cache datastore (e.g., Memcached or Redis) will fill up with old caches. You can mitigate it by adding an expiry time to all caches so old caches automatically disappear. You can also configure Memcached so it evicts the oldest caches to make room for new ones.
Introducing New Tech Should Make an Impossible Task Possible or Something 10x Easier
Most companies eventually have to evaluate new technologies. In the tech industry, you have to do this to stay relevant. However, introducing a new technology has two negative consequences. First, it becomes more difficult for developers to move across teams. This is a problem because it creates knowledge silos within the company, and slows down career growth. The second consequence is that fewer libraries or insights can be shared across the company because of the tech fragmentation. Moving over to new tech might come up because of people’s tendency to want to start over and write things from scratch—it’s almost always a bad idea. On the other hand, there are a few cases where introducing a new technology makes sense like when it enables your company to take on previously impossible tasks. It makes sense when the technical limitation of your current stack is preventing you from reaching your product goals.
Failure Modes
Designers and product folks focus on the expected use cases. As an engineer you also have to think about the worst case scenarios because that’s where the majority of your time will go. At scale, all bad things that can happen do happen. Asking “What could go wrong” or “How can I be wrong” really helps; these questions also cancel out our bias towards confirmation of our existing ideas. Think about what happens when no data, or a lot of data is flowing through the system (Think “Min-Max”). You should expect computers to occasionally die and handle those cases gracefully, and expect network requests to be slow or stall all together.
Management Mental Models
The key insight here is that "Management" might be the wrong name for this discipline all together. What you are really doing is growing people. You’ll rarely have to manage others if you align your interests with the people that report to you. Compared to engineering, management is more fuzzy and subjective. This is why engineers struggle with it. It's really about calibration; you are calibrating approaches for yourself and your reports. What works for you, might not work for me because the world has different expectations from us. Likewise, just reading books on this stuff doesn't help because advice from the book is calibrated for the author.
With that said, I believe the following mental models are falsifiable. I also believe that doing the opposite of these will always be harmful. I find these particularly valuable while planning my week. Enjoy!
Create Motivation by Aligning Incentives
Incentives drive our behavior above all else. You probably feel this yourself when you procrastinate on tasks that you don't really want to do. Work with your reports to identify the intersection of:
What do they want to work on?
What does the product need?
What does that company need?
The intersection of the three incentives
Magic happens when these questions produce themes that overlap with each other. The person will have intrinsic motivation for tasks that build their skills, improve their product, and their company. Working on the two intersecting themes to these questions can be fruitful too. You can replace 'product' with 'direct team' if appropriate.
Occasionally you'll find someone focusing on a task that's only:
done because that's what the person wants (neglecting the product and the company)
what the product needs (neglecting the person's needs or the company)
what the company wants (neglecting the person's needs or their product).
This is fine in the short term, but not a good long term strategy. You should nudge your reports towards these overlapping themes.
Create Clarity by Understanding the "Why" and Having a Vision for the Product
You should have a vision for where your product needs to go. This ends up being super helpful when deciding between competing tactical options and also helps clear up general confusion. You must communicate the vision with your team. While being a visionary isn't included in your job description, aligning on a "why" often counteracts the negative effects of broken-telephone effect in communication and entropy in organizations.
Focus on High Leverage Activities
This is the central idea in High output management. The core idea is similar to the "Pareto principle" where you focus your energy on the 20% of the tasks that have 80% of the impact. If you don't do this, your team will spend a lot of time, but not accomplish much. So, take some time to plan your approach and focus on the activities that give you the most leverage. I found Donella Medow’s research to be a super user for understanding leverage. A few examples of this include:
Promote Growth Mindset in Your Team
If you had to start with zero, what you'd want is the ability to acquire new skills. You want to instil a mindset of growth in yourself and the rest of the team. Create an environment where reflection and failures are talked about. Lessons that you truly learn are the ones that you have learnt by making mistakes. Create an environment where people obsess about the craft and consider failures a learning opportunity.
Align Your Team on the Common Vision
Aligning your team towards a common direction is one of the most important things you can do. It'll mean that people will go in the same general direction.
Build Self-organizing Teams
Creating self-sufficient teams is the only way to scale yourself. You can enable a team to do this by promoting a sense of ownership. You can give your input without taking authority away from others and offer suggestions without steamrolling leaders.
Communication and Structural Organization
You should focus on communication and organization tools that keep the whole team organized. Communication fragmentation leads to massive waste.
Get the Architecture Right
This is where your engineering chops will come in handy. From a technical perspective, getting the core pieces of the architecture right ends up being critical and defines the flow of information in the system.
Don’t Try to be Efficient with Relationships
As an engineer your brain is optimized to seek efficiency. Efficiency isn’t a good approach when it comes to relationships with people as you often have the opposite effect as to what you intended. I have found that 30 minute meetings are too fast for one-on-ones with your reports. You want to give some time for banter and a free flow of information. This eases people up, you have better conversations and they often end up sharing more critical information than they would otherwise. Of course, you don't want to spend a lot of time in meetings, so I prefer to have longer infrequent meetings instead of frequent short meetings.
This model also applies to pushing for changes or influencing others in any way. This is a long game, and you should be prepared for that. Permanent positive behavioral changes take time.
Hire Smart People Who Get Stuff Done and You Want to Be Around
Pick business partners with high intelligence, energy, and, above all, integrity. -@Naval
Hiring, when done right, is one of the highest-leverage activities that you can work on. You are looking for three key signals when hiring:
When looking for the "smart" signal, be aware of the "halo effect" and be weary of charmers. "Get stuff done" is critical because you don't want to be around smart people who aren’t adding value to your company. Just like investing, your aim should be to identify people on a great trajectory. "Good to be around" is tricky because it's filled with personal bias. A good rule is to never hire assholes. Even if they are smart and get stuff done, they’ll do that at the expense of others and wreak havoc on the team. Avoid! Focus on hiring people that you would want long term relationships with. It is also important to differentiate between assholes and disagreeable people. A disagreeable and useful person is much better to be around than someone who is agreeable but not useful.
Be Useful
You could behave in a number of different ways at any given time or interaction. What you want is to be useful and add value. There is a useful way of giving feedback to someone that reports you and a useful way to review code. Apply this to yourself and plan your day to be more useful to others. Our default instinct is to seek confirmation bias and think about how we are right. We don’t give others the same courtesy. The right approach is to reverse that default instinct: Think “how can I make this work” for other people, and “how can this be wrong” for your own ideas.
Don’t compete with your reports either. As a manager, this is particularly important because you want to grow your reports. Be aware of situations or cases where you might be competing, and default to being useful instead of pushing your own agenda.
Get the Requirements Right Early and Come Up with a Game Plan
Planning gets a bad rep in fast moving organizations, but it ends up being critical in the long term. Doing some planning almost always ends up being much better than no planning at all. What you want to do is plan until you have a general direction defined and start iterating towards that. There are a few questions can help getting these requirements right:
What are the things that we want in the near future? You want to pick the path that gives you the most options for the expected future.
How can this be wrong? Counteract your confirmation bias with this question by explicitly thinking about failure modes.
Where do you not want to go? Inversion ends up being really useful. It’s easier to avoid stupidity than seeking brilliance
What happens once you get there? Seek second order effects. What will one path unlock or limit?
What other paths could you take? Has your team settled on a local maxima instead and not the global maxima?
Once you have a decent idea of how to proceed with this, you are responsible for communicating this plan with the rest of the team too. Not getting the requirements right early on means that your team can potentially end up going in the wrong direction which ends up being a net negative.
Establish Rapport Before Getting to Work
You will be much more effective at work, if you connect with the other people before getting to work. This could mean banter, or just listening—there’s a reason why people small-talk. Get in the circle before attempting to change the circle. This leads to numerous positive improvements in your workflow. Slack conversations will sound like conversations instead of arguments and you'll assume positive intent. You’ll also find that getting alignment in meetings and nudging reports towards positive changes ends up being much more useful this way. Icebreakers in meetings and room for silliness helps here.
There Is No One-size-fits-all Approach to People. Personality Tests Are Good Defaults
Management is about calibration. You are calibrating your general approach to others, while calibrating a specific approach to each person. This is really important because an approach that might work for one person won’t work on others. You might find that personality tests like the Enneagram serve as great defaults to approaching a person. Type-5, the investigators, work best when you give them autonomy and new ideas. Type-6, the loyalists, typically want frequent support and the feeling of being entrusted. The Last Dance miniseries on Netflix is a master class on this topic.
Get People to Lead with Their Strengths and Address Their Growth Areas as a Secondary Priority
There are multiple ways to approach a person's personal growth. I’ve found that what works best is first identifying their strengths and then areas of improvements. Find people’s strengths and obsessions then point them to that. You have to get people to lead with their strengths. It’s the right approach because it gives people confidence and momentum. Turns out, that’s also how they add the most value. Ideally, one should develop to be more well-rounded, so it’s also important to come up with a game plan for addressing any areas of improvements.
Focus on the Positives and Don't Over Index on the Negatives
For whatever reasons, we tend to focus on the negatives more than we should. It might be related to "deprival super reaction syndrome" where we hate losing more than we like winning. In management, we might have the proclivity to focus on what people are doing poorly instead of what they’re doing well. People may not feel appreciated if you only focus on the negatives. I believe this also means that we end up focusing on improving low-performers more than amplifying high-performers. Amplifying high-performers may have an order of magnitude higher impact.
People Will Act Like Owners if You Give Them Control and Transparency
Be transparent and don’t do everything yourself. Talk to people and make them feel included. When people feel left out of the loop, they generally grow more anxious as they feel that they’re losing control. Your ideal case is that your reports act like owners. You can do this by being transparent about how decisions are made. You also have to give others control and autonomy. Expect some mistakes as they calibrate their judgement and nudge in the right direction instead of steamrolling them.
There are other times where you'll have to act like an owner and lead by example. One hint of this case will be when you have a nagging feeling about something that you don't want to do. Ultimately, the right thing here is to take full ownership and not ask others to do what you wouldn't want.
Have High Standards for Yourself and the People Around You
Tech markets and products are generally winner-take-most. This means that second place isn’t a viable option—winning, in tech, leads to disproportionately greater rewards. Aim to be the best in the world in your space and iterate towards that. There’s no point in doing things in a mediocre way. Aiming high, and having high standards is what pushes everything forward.
To make this happen, you need to partner with people who expect more from you. You should also have high standards for your reports. One interesting outcome of this is that you get the positive effects of the Pygmalion effect: people will rise to your positive expectations.
Hold People Accountable
When things don't get delivered or when you see bad behavior, you have to have high standards and hold people accountable. If you don't, that's an implicit message that these bad outcomes are ok. There are many cases where not holding others accountable can have a spiraling effect.
Your approach to this has to be calibrated for your work style and the situation. Ultimately, you should enforce all deal-breaker rules. Set clear expectations early on. When something goes wrong, work with the other person or team to understand why. Was it a technical issue, does the tooling need to be improved, or was it an issue with leadership?
Bring Other People Up with You
We like working with great and ambitious people because they raise the bar for everyone else. We’re allergic to self-obsessed people who only care about their own growth. Your job as a manager is to bring other people up. Don’t take credit for work that you didn’t do and give recognition to those that did the work. What's interesting is that most people only really care about their own growth. So, being the person who actually spends time thinking about the growth of others differentiates you, making more people want to work with you.
Maintain Your Mental Health with Mindfulness, Rest, and Distance
A team's culture is top down and bottom up. This means people mimic the behavior of others in the position of authority—for better or for worse. Keeping this in mind, you have to be aware of your own actions. Generally, most people become less aware of their actions as fatigue builds up. Be mindful of your energy levels when entering meetings. Energy and positivity is phenomenal, because it's something that you can give to others, and it doesn't cost you anything.
Stress management is another important skill to develop. Most people can manage problems with clear yes/no solutions. Trickier problems with nuances and unclear paths, or split decisions tend to bubble up. Ambiguity and conflicting signals are a source of stress for many people and treating this like a skill is really important. Dealing with stressful situations by adding more emotion generally doesn't help. Keep your cool in stressful situations.
Aim to Operate Two to Three Months Into the Future
As an engineer you typically operate in scope between days and weeks. As you expand your influence, you also have to start thinking in a greater time horizon. As a manager, your horizon will be longer than a typical engineer, but smaller than someone who focuses on high level strategy. This means that you need to project your team and reports a few months into the future and anticipate their challenges. Ideally, you can help resolve these issues before they even happen. This exercise also helps you be more proactive instead of reacting to daily events.
Give Feedback to People That You Want Long Term Relationships with
Would you give feedback to a random stranger doing something that's bad for them? Probably not. Now, imagine that you knew this person. You would try to reason with this person, and hopefully nudge them in the right direction. You give feedback to people that you care about and want a long term relationship with. I believe this is also true at work. Even if someone isn’t your report, it’s worth sharing your feedback if you can deliver it usefully.
Giving feedback is tricky since people often get defensive. There are different schools of thoughts on this, but I try to build a rapport with someone before giving them direct feedback. Once you convince someone that you are on their side, people are much more receptive to it. Get in the circle. While code review feedback is best when it's all at once, that isn't necessarily true for one-on-one feedback. Many people default to quick-feedback and I think that doesn't work for people you don't have good rapport with and that it only really works if you are in a position of authority. The shortest path is not always the path of least resistance, and so you should build rapport before getting to work.
ShipIt! Presents: Building Mental Models of Ideas That Don’t Change
Wherever you are, your next journey starts here! If building systems from the ground up to solve real-world problems interests you? Visit our Engineering career page to find out about our open positions.
Shopify’s Online Store provides greater flexibility to build themes representing the brand of a merchant’s online store. However, like with any programming language, one often writes code without being aware of all the performance impact it creates. Whether it be performance impact on Shopify’s servers or observable performance impact on the browser, ultimately, it’s the customers that experience the slowness. The speed of server-side rendering is one of the most important performance timings to optimize for. That’s because customers wait on a blank screen until server-side rendering completes. Even though we’re working hard to make server-side rendering as fast as possible, bottlenecks may originate from the Liquid source itself.
In this article, I’ll look at:
how to interpret flame graphs generated by the Shopify Theme Inspector
what kind of flame graphs generate from unoptimized Liquid code patterns
tips for spotting and avoiding these performance issues.
The flame graph produced by this tool is a data representation of the code path and the time it took to execute. With this tool, as a developer, you can find out how long a piece of code took to render.
Start with Clean Code
We often forget what a clean implementation looks like, and this is often how we, Shopify, envision this piece of liquid code will be used—it’s often not the reality as developers will find their own ways to achieve their goals. As time passes, code becomes complicated. We need to go back to the clean implementation to understand what makes it take the time to render.
The simple code above creates a flame graph that looks like this image below:
Flame graph for a 10 item paginated collection
The template section took 13 ms to complete rendering. Let’s have a better understanding of what we are seeing here.
Highlighted flame graph for a 10 item paginated collection
The area where the server took the time to render is where the code for the pagination loop is executed. In this case, we rendered 10 product titles. Then there’s a block of time that seems to disappear. It‘s actually the time spent on Shopify’s side collecting all the information that belongs to the products in the paginate collection.
Look at Inefficient Code
To know what’s an inefficient code, one must know what it looks like, why it is slow, and how to recognize it in the flame graph. This section walks through a side-by-side comparison of code and it’s flame graphs, and how a simple change results in bad performance.
Heavy Loop
Let’s take that clean code example and make it heavy.
What I’ve done here is accessed attributes in a product while iterating through a collection. Here’s the corresponding flame graph:
Flame graph for a 10 item paginated collection with accessing to its attributes
The total render time of this loop is now at 162 ms compared to 13 ms from the clean example. The product attributes access changes a less than 1 ms render time per tile to a 16 ms render time per tile. This produces exactly the same markup as the clean example but at the cost of 16 times more rendering time. If we increase the number of products to paginate from 10 to 50, it takes 800 ms to render.
Tips:
Instead of focusing on how many 1 ms bars there are, focus on the total rendering time of each loop iteration
Clean up any attributes aren’t being used
Reduce the number of products in a paginated page (Potentially AJAX the next page of products)
Simplify the functionality of the rendered product
Nested Loops
Let’s take that clean code example and make it render with nested loops.
This code snippet is a typical example of iterating through the options and variations of a product. Here’s the corresponding flame graph:
Flame graph for two nested loop example
This code snippet is a two-level nested loop rendering at 55 ms.
Nested loops are hard to notice when just looking at code because it’s separated by files. With the flame graph, we see the flame graph start to grow deeper.
Flame graph of a single loop on a product
As highlighted in the above screenshot, the two inner for-loops stacks side by side. This is okay if there are only one or two loops. However, each iteration rendering time will vary based on how many inner iterations it has.
Let’s look at what a three nested loop looks like.
Flame graph for three nested loop example
This three level nested loop rendered at 72 ms. This can get out of hand really quickly if we aren’t careful. A small addition to the code inside the loop could blow your budget on server rendering time.
Tips:
Look for a sawtooth shaped flame graph to target potential performance problem
Evaluate each flame graph layer and see if the nested loops are required
Flame graph of when there’s one item in the cart with rendering time at 45 ms
Flame graph of when there’s 10 items in the cart with rendering time at 124 ms
This flame graph is an example of a badly nested loop where each variation is accessing the cart items. As more items are added to the cart, the page takes longer to render.
Tips:
Look for hair comb or sawtooth shaped flame graph to target potential performance problem
Compare flame graphs between one item and multiple items in cart
Don’t mix global liquid variable usage. If you have to, use AJAX to fetch for cart items instead
What is Fast Enough?
Try to aim for 200 ms but no more than 500 ms total page rendering time reported by the extension. We didn’t just pick a number out of the hat. It’s made with careful consideration of what other allocation of available time during a page render that we need to include to hit a performance goal. Google Web Vitals stated that a good score for Largest Content Paint (LCP) is less than 2.5 seconds. However, the largest content paint is dependent on many other metrics like time to first byte (TTFB) and first content paint (FCP). So, let’s make some time allocation! Also, let’s understand what each metric represents:
From Shopify’s server to a browser is the network overhead time required. It varies based on the network the browser is on. For example, navigating your store on 3G or Wi-Fi.
From a browser blank page (TTFB) to showing anything (FCP) is the time the browser needs to read and display the page.
From the FCP to the LCF is the time the browser needs to get all other resources (images, css, fonts, scripts, video, … etc.) to complete the page.
The goal is an LCP < 2.5 seconds to receive a good score
Server → Browser
300 ms for network overhead
Browser → FCP
200 ms for browser to do its work
FCP → LCP
1.5 sec for above the fold image and assets to download
Which leaves us 500 ms for total page render time.
Does this mean that as long as we keep server rendering below 500 ms, we can get a good LCP score? No, there’s other considerations like critical rendering path that aren’t addressed here, but we’re at least half way there.
Tip:
Optimizing for critical rendering path on the theme level can bring the 200 ms requirement between the browser to FCP timing down to a lower number.
So, we have 500 ms for total page render time, but this doesn’t mean you have all 500 ms to spare. There’s some mandatory server render times that are dedicated to Shopify and others that the theme dedicates to rendering global sections like the header and footer. Depending how you want to allocate the rendering resources, the available rendering time you leave yourself for the page content varies. For example:
Total
500 ms
Shopify (content for header)
50 ms
Header (with menu)
100 ms
Footer
25 ms
Cart
25 ms
Page Content
300 ms
I mentioned trying to aim for 200 ms total page rendering time—this is a stretch goal. By keeping ourselves mindful of a goal, it’s much easier to start recognizing when performance starts to degrade.
An Invitation to the Shopify Theme Developer Community
We couldn’t possibly know every possible combination of how the world is using Shopify. So, I invite you to share your experience with Shopify’s Theme Inspector and let us know how we can improve at https://github.com/Shopify/shopify-theme-inspector/issues/41 or tweet us at @shopifydevs.
Wherever you are, your next journey starts here! If building systems from the ground up to solve real-world problems interests you, our Engineering blog has stories about other challenges we have encountered. Intrigued? Visit our Engineering career page to find out about our open positions and learn about Digital by Default.
Last year, our marketing team kicked off a large effort based on user research to revamp shopify.com to better serve the needs of our site visitors. We recognized that visitors wanted to see screenshots and visuals of the product itself, however we found that most of the screenshots across our website were outdated.
Old Shopify POS software on shopify.com
The above image was used to showcase our Shopify POS software on shopify.com, however it misrepresented our product when our POS software was updated and rebranded.
While we first experimented with a Scalable Vector Graphics (SVG) based solution to visuals, we found that it wouldn’t scale and forced us to restrict usage to only “high-value” pages. Still, other teams expressed interest in this approach, so we recreated these in HTML and JavaScript (JS) and compared the lift between them. The biggest question was around getting these to resize in a given container—with SVG all content, including text size, grows and shrinks proportionally with a width of 100%, appearing as an image to users. With CSS there’s no way to get font sizes to scale proportionally to a container, only the window. We created a solution that resizes all the contents of the element at the same rate in response to container size, and reused it to create a better shopify.com.
The Design Challenge
We wanted to create new visuals of our product that needed to be available and translated across more than 35 different localized domains. Many domains support different currencies, features, and languages. Re-capturing screenshots on each domain to keep in sync with all our product changes is extremely inefficient.
Screenshots of our product were simplified in order to highlight features relevant to the page or section.
After a number of iterations and as part of a collaborative effort outlined in more detail by Robyn Larsen on our UX blog, our design team came up with simplified representations of our user interface, UI Illustrations as we called them, for the parts of the product that we wanted to showcase. This was a clever solution to drive user focus to the parts of the product that we’re highlighting in each situation, however it required that someone maintain translations and versions of the product as separate image assets. We had an automated process for updating translations in our code but not in the design editor.
What Didn’t Work: The SVG Approach
As an experimental solution, we attempted to export these visuals as SVG code and added those SVGs inline in our HTML. Then we’d replace the text and numbers with translated and localized text.
SVGs don’t support word wrapping so visuals with long translations would look broken.
Exported SVGs were cool, they actually worked to accomplish what we had set out to do, but they had a bunch of drawbacks. Certain effects like gaussian blur caused performance issues in Firefox, and SVG text doesn’t wrap when reaching a max-width like HTML can. This resulted in some very broken looking visuals (see above). Languages with longer word lengths, like German, had overflowing text. In addition, SVG export settings in our design tool needed to be consistent for every developer to avoid massive changes to the whole SVG structure every time someone else exported the same visual. Even with a consistent export process, the developer would have to go through the whole process of swapping out text with our own hooks for translated content again. It was a huge mess. We were writing a lot of documentation just to create consistency in the process, and new challenges kept popping up when new settings in Sketch were used. It felt like we had just replaced one arduous process with another.
Our strategy of using SVGs for these visuals was quickly becoming unmanageable, and that was just with a few simple visuals. A month in, we still saw a lot of value in creating visuals as code, but needed to find a better approach.
Our Solution: The HTML/JavaScript Approach
After toying around with using JS to resize the content, we ended up with a utility we call ScaleContentAsImage. It calculates how much size is available for the visual and then resizes it to fit in that space. Let’s break down the steps required to do this.
Starting with A Simple Class
We start by creating a simple class that accepts a reference to the element in the DOM that we want to scale, and initialize it by storing the computed width of the element in memory. This assumes that we assigned the element a fixed pixel width somewhere in our code already (this fixed pixel width matches the width of the visual in the design file). Then we override the width of the element to 100% so that it can fill the space available to it.I’ve purposely separated the initialization sequence into a separate method from the constructor. While not demonstrated in this post, that separation allows us to add lazy loading or conditional loading to save on performance.
Creating an Element That We Can Transform
Next we’ll need to create an element that will scale as needed using a CSS transform. We assign that wrapper the fixed width that its parent used to have. Note that we haven’t actually added this element anywhere in the DOM yet.
Moving the Content Over
We transfer all the contents of the visual out from where it is now and into the wrapper we just created, and put that back into the parent element. This method preserves any event bindings (such as lazy load listeners) that previously were bound to these elements. At this point the content might overflow the container, but we’ll apply the transform to resolve that.
Applying the Transformation
Now, we determine how much the wrapper should scale the contents by and apply that property. For example, if the visual was designed to be 200px wide but it’s rendered in an element that’s 100px wide, the wrapper would be assigned transform: scale(0.5);.
Preserving Space in the Page
A screenshot of a webpage in a desktop view with text content aligned to the left and an image on the right.
So now our visual is resizing correctly, however our page layout is now looking all wonky. Our text content and the visual are meant to display as equal width side-by-side, like the above.
So why does the page look like this? The colored highlight shows what’s happening with our CSS transform.
A screenshot of a webpage in a desktop viewport after CSS transform.
CSS transforms don’t change the content flow, so even though our visual size is reduced correctly, the element still takes up its fixed width. We add some additional logic here to fix this problem by adding an empty element that takes up the correct amount of vertical space. Unless the visual contains images that are lazy loaded, or animates vertically in some way, we only need to make this calculation once since a simple CSS trick to maintain an aspect ratio will work just fine.
Removing the Transformed Element from the Document Flow
We also need to set the transformed element to be absolutely positioned, so that it doesn’t affect the document flow.
A screenshot of a webpage in a desktop view with text content aligned to the left and an image on the right.
Binding to Resize
Success! Looks good! Now we just add a bit of logic to update our calculations if the window is resized.
Finishing theCode
Our class is now complete.
Looking at the Detailed Changes in the DOM
1. Before JS is initialized, in this example the container width is 378px and the assigned width of the element is 757px. The available space is about 50% of the original size of the visual.
A screenshot of a page open in the browser with developer tools open
2. As seen in our HTML post-initialization, in JS we have overridden the size of the container to be 100%.
3. We’ve also moved all the content of the visual inside of a new element that we created, to which we apply a scale of 0.5 (based on the 50% calculated in step 1).
4. We absolutely position the element that we scaled so that it doesn’t disturb the document flow.
5. We added a placeholder element to preserve the correct amount of space in the document flow.
A Solution for a React Project
For a project using React, the same thing is accomplished without any of the logic we wrote to create, move, or update the DOM elements. The result is a much simpler snippet that only needs to worry about determining how much space is available within its container. A project using CSS-in-JS benefits in that the fixed width is directly passed into the element.
Problems with Localization and Currency
Shopify admin order summary page
An interesting problem we ran into was displaying prices in local currencies for fictional products. For instance, we started off with a visual of a product, a checkout button, and an order summary. Shown in the order summary were two chairs, each priced at ~$200, which were made-up prices and products for demonstrative purposes only.
It didn’t occur to us that 200 Japanese Yen is the equivalent of under $1.89 USD (today), so when we just swapped the currency symbol the visual of the chair did not realistically match the price. We ended up creating a table of currency conversion rates pulled on that day. We don’t update those conversion values on a regular basis, since we don’t need accurate rates for our invented prices. We’re ok with fluctuations, even large ones, as long as the numbers look reasonable in context. We obviously don’t take this approach with real products and prices.
Comparing Approaches: SVG vs HTML/JavaScript
The HTML/JS approach took some time to build upfront, but its advantages clearly outweighed the developer lift required even from the start. The UI Illustrations were fairly quick to build out given how simply and consistently they were designed. We started finding that other projects were reusing and creating their own visuals using the same approach. We created a comparison chart between approaches, evaluating major considerations and the support for these between the two.
Text Support
While SVG resizes text automatically and in proportion to the visual resizing, it didn’t support word wrap which is available in HTML
Implementation and Maintenance
HTML/JS had a lot going for compared to the SVG approach when it came to implementation and maintenance. Using HTML and JS would mean that developers don’t need to have technical knowledge of SVGs, and they code these visuals with the help of our existing components. Code is easy to parse and tested using our existing testing framework. From an implementation standpoint, the only thing that SVG really had going for it was that it usually resulted in fewer lines of code, since styles are inline and elements are absolutely positioned relative to each other. That in itself isn’t reason to choose a less maintainable and human-readable solution.
Animation
While both would support animations—something we may want to add in the future—an HTML/JS approach allows us to easily use our existing play/pause buttons to control these animations.
Accessibility
The SVG approach works with JS disabled, however it’s less performant and caused a lot of jankiness on the page when certain properties like shadows were applied to it
Design
Design is where HTML/JS really stood out against SVG. With our original SVG approach, designers needed to follow a specific process and use a specific design tool that worked with that process. For example, we started requiring that shadows applied to elements were consistent in order to prevent multiple versions of Gaussian Blur from being added to the page and creating jankiness. It also required our designers to design in a way that text would never break onto a new line because of the lack of support for word wrapping. Without introducing SVG, none of these concerns applied and designers had more flexibility to use any tools they wanted to build freely.
Documentation and Ramp-up
HTML/JS was a clear winner , as we did away with all of the documentation describing the SVG export process, design guidelines, and quirks we discovered. With HTML, all we’d need to document that wouldn’t apply to SVGs is how to apply the resize functionality to the content.
Scaling Our Solution
We started off with a set of named visuals, and designed our system around a single component that accepted a name (for example “Shopify admin dashboard” or “POS software”) and rendered the desired visual. We thought that having a single entry point would help us better track each visual and restrict us to a small, maintainable set of UI Illustrations. That single component was tested and documented and for each new visual we added respective tests and documentation.
We worried about overuse given that each UI Illustration needed to be maintained by a developer. But with this system, a good portion of that development effort ended up being the education of the structure, maintenance of documentation, and tests for basic HTML markup that’s only used in one place. We’ve since provided a more generic container that can be used to wrap any block of HTML for initialization with our ScaleContentLikeImage module and provides a consistent implementation of descriptive text for screen readers.
The Future of UI Illustrations
ScaleContentLikeImage and its application for our UI Illustrations is a powerful tool for our team to highlight our product in a very intentional and relevant way for our users. Jen Taylor dives deeper into our UX considerations and user-focused approach to UI Illustrations on the Shopify UX Blog. There are still performance and structural wins to be had, specifically around how we recalculate sizing for lazy loaded images, and how we document existing visuals for reuse. However, until there’s a CSS-only solution to handle this use case our HTML/JS approach seems to be the cleanest. Looking to the future, this could be an excellent application to explore with CSS Houdini once the layout API is made available (it’s not yet supported in any major browser).
We’ve all learned a lot in this process and like any system, its long term success relies on our team’s collaborative relationship in order to keep evolving and growing in a maintainable, scalable way. At Shopify one of our core values is to thrive on change, and this project certainly has done so.
On September 30, 2020 we held ShipIt! presents: Packwerk by Shopify. A video for the event is now available for you to learn more about our latest open source tool for creating packages with enforced boundaries in Rails apps. Click here to watch the video.
The Shopify core codebase is large, complex, and growing by the day. To better understand these complex systems, we use software architecture to create structural boundaries. Ruby doesn't come with a lot of boundary enforcements out of the box. Ruby on Rails only provides a very basic layering structure, so it's hard to scale the application without any solid pattern for boundary enforcement. In comparison, other languages and frameworks have built-in mechanisms for vertical boundaries, like Elixir’s umbrella projects.
As Shopify grows, it’s crucial we establish a new architecture pattern so large scale domains within the monolith can interact with each other through well-defined boundaries, and in turn, increase developer productivity and happiness.
So, we created an open source tool to build a package system that can be used to guide and enforce boundaries in large scale Rails applications. Packwerk is a static analysis tool used to enforce boundaries between groups of Ruby files we call packages.
High Cohesion and Low Coupling In Code
Ideally, we want to work on a codebase that feels small. One way to make a large codebase feel small is for it to have high cohesion and low coupling.
Cohesion refers to the measure of how much elements in a module or class belong together. For example, functional cohesion is when code is grouped together in a module because they all contribute to one single task. Code that is related changes together and therefore should be placed together.
On the other hand, coupling refers to the level of dependency between modules or classes. Elements that are independent of each other should also be independent in location of implementation. When a certain domain of code has a long list of dependencies of unrelated domains, there’s no separation of boundaries.
Boundaries are barriers between code. An example of a code boundary is to have a separate repository and service. For the code to work together in this case, network calls have to be made. In our case, a code boundary refers to different domains of concern within the same codebase.
With that, there are two types of boundaries we’d like to enforce within our applications—dependency and privacy. A class can have a list of dependencies of constants from other classes. We want an intentional and ideally small list of dependencies for a group of relevant code. Classes shouldn’t rely on other classes that aren’t considered their dependencies. Privacy boundaries are violated when there’s external use of private constants in your module. Instead, external references should be made to public constants, where a public API is established.
A Common Problem with Large Rails Applications
If there are no code boundaries in the monolith, developers find it harder to make changes in their respective areas. You may remember making a straightforward change that shockingly resulted in the breaking of unrelated tests in a different part of the codebase, or digging around a codebase to find a class or module with more than 2,000 lines of code.
Without any established code boundaries, we end up with anti-patterns such as spaghetti code and large classes that know too much. As a codebase with low cohesion and high coupling grows, it becomes harder to develop, maintain, and understand. Eventually, it’s hard to implement new features, scale and grow. This is frustrating to developers working on the codebase. Developer happiness and productivity when working on our codebase is important to Shopify.
Rails Is Like an Open-concept Living Space
Let’s think of a large Rails application as a living space within a house without any walls. An open-concept living space is like a codebase without architectural boundaries. In an effort to separate concerns of different types of living spaces, you can arrange the furniture in a strategic manner to indicate boundaries. This is exactly what we did with the componentization efforts in 2017. We moved code that made sense together into folders we call components. Each of the component folders at Shopify represent domains of commerce, such as orders and checkout.
In our open-concept analogy, imagine having a bathroom without walls—it’s clear where the bathroom is supposed to be, but we would like it to be separate from other living spaces with a wall. The componentization effort was a great first step towards modularity for the great Shopify monolith, but we are still far from a modular codebase—we need walls. Cross-component calls are still being made, and Active Record models are shared across domains. There’s no wall imposing those boundaries, just an agreed upon social contract that can be easily broken.
Boundary Enforcing Solutions We Researched
The goal is to find a solution for boundary enforcement. The Ruby we all know and love doesn't come with boundary enforcements out of the box. It allows specifying visibility on the class level only and loads all dependencies into the global namespace. There’s no differences between direct and indirect dependencies.
There are some existing ways of potentially enforcing boundaries in Ruby. We explored a combination of solutions: using the private_constant keyword to set private constants, creating gems to set boundaries, using tests to prevent cross-boundary associations, and testing out external gems such as Modulation.
Setting Private Constants
The private_constant keyword is a built-in Ruby method to make a constant private so it cannot be accessed outside of its namespace. A constant’s namespace is the modules or classes where it’s nested and defined. In other words, using private_constant provides visibility semantics for constants on a namespace level, which is desirable. We want to establish public and private constants for a class or a group of classes.
However, there are drawbacks of using the private_constant method of privacy enforcement. If a constant is privatized after it has been defined, the first reference to it will not be checked. It is therefore not a reliable method to use.
There’s no trivial way to tell if there’s a boundary violation using private_constants. When declaring a constant private to your class, it is hard to determine if the use of the constant is getting bypassed or used appropriately. Plus, this is just a solution for privacy issues and not dependency.
Overall, only using private_constant is insufficient to enforce boundaries across large domains. We want a tool that is flexible and can integrate into our current workflow.
Establishing Boundaries Through Gems
The other method of creating a modular Rails application is through gems. Ruby gems are used to distribute and share Ruby libraries between Rails applications. People may place relevant code into an internal gem, separating concerns from the main application. The gem may also eventually be extracted from the application with little to no complications.
Gems provide a list of dependencies through the gemspec which is something we wanted, but we also wanted the list of dependencies to be enforced in some way. Our primary concern was that gems don't have visibility semantics. Gems make transitive dependencies available in the same way as direct dependencies in the application. The main application can use any dependency within the internal gem as it would its own dependency. Again, this doesn't help us with boundary enforcement.
We want a solution where we’re able to still group code that’s relevant together, but only expose certain parts of that group of code as public API. In other words, we want to control and enforce the privacy and dependency boundaries for a group of code—something we can’t do with Ruby gems.
Using Tests to Prevent Cross-component Associations
We added a test case that rejects any PRs that introduce Active Record associations across components, which is a pattern we’re trying to avoid. However, this solution is insufficient for several reasons. The test doesn’t account for the direction of the dependency. It also isn’t a complete test. It doesn’t cover use cases of Active Record objects that aren’t associations and generally doesn’t cover anything that isn’t Active Record.
The test was good enforcement, but lacked several key features. We wanted a solution that determined the direction of dependencies and accounted for different types of Active Record associations. Nonetheless, the test case still exists in our codebase as we still found it helpful in triggering developer thought and discussions to whether or not an association between components is truly needed.
Using the Modulation Ruby Gem
Modulation is a Ruby gem for file-level dependency management within the Ruby application that was experimental at the time of our exploration. Modulation works by overriding the default Ruby code loading, which is concerning, as we’d have to replace the whole autoloading system in our Rails application. The level of complexity added to the code and runtime application behaviour is because dependency introspection performed at runtime.
There are obvious risks that come with modifying how our monolith works for an experiment. If we went with Modulation as a solution and had to change our minds, we’d likely have to revert changes to hundreds of files, which is impractical in a production codebase. Plus, the gem works at file-level granularity which is too fine for the scale we were trying to solve.
Creating Microservices?
The idea of extracting components from the core monolith into microservices in order to create code boundaries is often brought up at Shopify. In our monolith’s case, creating more services in an attempt to decouple code is solving code design problems the wrong way.
Distributing code over multiple machines is a topology change, not an architectural change. If we try to extract components from our core codebase into separate services, we introduce the added concern of networked communication and create a distributed system. A poorly designed API within the monolith will still be a poorly designed API within a service, but now with additional complexities. These complexities can come in forms such as stateless network boundary and serialisation between the systems, and reliability issues with networked communications. Microservices are a great solution when the service is isolated and unique enough to reason the tradeoff of the network boundary and complexities that come with it.
The Shopify core codebase still stands as a majestic modular monolith, with all the code broken up into components and living in a singular codebase. Now, our goal is to advance our application’s modularity to the next step—by having clear and enforced boundaries.
Packwerk: Creating Our Own Solution
Taking our learnings from the exploration phase for the project, we created Packwerk. There are two violations that Packwerk enforces: dependency and privacy. Dependency violations occur when a package references a private constant from a package that hasn’t been declared as a dependency. Privacy violations occur when an external constant references a package’s private constants. However, constants within the public folder, app/public, can be accessed and won't be a violation.
How Packwerk Works
Packwerk parses and resolves constants in the application statically with the help of an open-sourced Shopify Ruby gem called ConstantResolver. ConstantResolver uses the same assumptions as Zeitwerk, the Rails code loader, to infer the constant's file location. For example, Some::Nested::Model will be resolved to the constant defined in the file path, models/some/nested/model.rb. Packwerk then uses the file path to determine which package defines the constant.
Next, Packwerk will use the resolved constants to check against the configurations of the packages involved. If all the checks are enforced (i.e. dependency and privacy), references from Package A to Package B are valid if:
Package A declares a dependency on Package B, and;
The referenced constant is a public constant in Package B
Ensuring Application Validity
Before diving into further details, we have to make sure that the application is in a valid state for Packwerk to work correctly. To be considered valid, an application has to have a valid autoload path cache, package definition files and application folder structure. Packwerk comes with a command, packwerk validate, that runs on a continuous integration (CI) pipeline to ensure the application is always valid.
Packwerk also checks for any acyclic dependencies within the application. According to the Acyclic Dependency Principle, no cycles should be allowed in the component dependency graph. If packages depend on each other in a cycle, making a change to one package will create a domino effect and force a change on all packages in the cycle. This dependency cycle will be difficult to manage.
In practical terms, imagine working on a domain of the codebase concurrently with 100 other developers. If your codebase has cyclic dependencies, your change will impact the components that depend on your component. When you are done with your work, you want to merge it into the main branch, along with the changes of other developers. This code will create an integration nightmare because all the dependencies have to be modified in each iteration of the application.
An application with an acyclic dependency graph can be tested and released independently without having the entire application change at the same time.
Creating a Package
A package is defined by a package.yml file at the root of the package folder. Within that file, specific configurations are set. Packwerk allows a package to declare the type of boundary enforcement that the package would like to adhere to.
Additionally, other useful package-specific metadata can be specified, like team and contact information for the package. We’ve found that having granular, package-specific ownership makes it easier for cross-team collaboration compared to ownership of an entire domain.
Enforcing Boundaries Between Packages
Running packwerk check
Packwerk enforces boundaries between packages through a check that can be run both locally and on the CI pipeline. To perform a check, simply run the line packwerk check. We also included this in Shopify’s CI pipeline to prevent any new violations from being merged into the main branch of the codebase.
Enforcing Boundaries in Existing Codebases
Because of the lack of code structure in Rails apps, legacy large scale Rails apps tend to have existing dependency and privacy violations between packages. If this is the case, we want to stop the bleeding and prevent new violations from being added to the codebase.
Users can still enforce boundaries within the application despite existing violations, ensuring the list of violations doesn't continue to increase. This is done by generating a deprecated references list for the package.
We want to allow developers to continue with their workflow, but prevent any further violations. The list of deprecated references can be used to help a codebase transition to a cleaner architecture. It iteratively establishes boundaries in existing code as developers work to reduce the list.
List of deprecated references for components/online_store
The list of deprecated references contains some useful information about the violation within the package. In the example above, we can tell that there was a privacy violation in the following files that are referring to the ::RetailStore constant that was defined in the components/online_store package.
By surfacing the exact references where the package’s boundaries are being breached, we essentially have a to-do list that can be worked off.
Conventionally, the deprecated references list was meant for developers to start enforcing the boundaries of an application immediately despite existing violations, and use it to remove the technical debt. However, the Shipping team at Shopify found success using this list to extract a domain out of their main application into its own service. Also, the list can be used if the package were extracted into a gem. Ultimately, we make sure to let developers know that the list of deprecated references should be used to refactor the code and reduce the amount of violations in the list.
The purpose of Packwerk would be defeated if we merely added to the list of violations (though, we’ve made some exceptions to this rule). When a team is unable to add a dependency in the correct direction because the pattern doesn’t exist, we recommend adding the violation to the list of deprecated references. Doing so will ensure that when such a pattern exists, we eventually refactor the code and remove the violation from the list. This results in a better alternative than creating a dependency in the wrong direction.
Preventing New Violations
After creating packages within your application and enforcing boundaries for those packages, Packwerk should be ready to go. Packwerk will display violations when packwerk check is run either locally or on the CI pipeline.
The error message as seen above displays the type of violation, location of violation, and provides actionable next steps for developers. The goal is to make developers aware of the changes they make and to be mindful of any boundary breaking changes they add to the code.
The Caveats
Statically analyzing Ruby is complex. If a constant is not autoloaded, Packwerk ignores it. This ensures that the results produced by Packwerk won’t have any false positives, but it can create false negatives. If we get most of the references right, it’ll be enough to shift the code quality in a positive direction. The Packwerk team made this design decision as our strategy to handle the inaccuracy that comes with Ruby static analysis.
How Shopify Is Using Packwerk
There was no formal push for the adoption of Packwerk within Shopify. Several teams were interested in the tool and volunteered to beta test before it was released. Since its release, many teams and developers are adopting Packwerk to enforce boundaries within their components.
Currently Packwerk runs in six Rails applications at Shopify, including the core monolith. Within the core codebase, we have 48 packages with 30 boundary enforcements within those packages. Packwerk integrates in the CI pipeline for all these applications and has commands that can run locally for packaging-related checks.
Since Packwerk was released for use within the company, new conversations related to software architecture have been sparked. As developers worked on removing technical debt and refactoring the code using Packwerk, we noticed there’s no established pattern for decoupling of code and creating single-direction dependencies. We’re currently researching and discussing inversion of control and establishing patterns for dependency inversion within Rails applications.
To get Packwerk installed in your Rails application, add it as a gem and simply run the command packwerk init. The command will generate the configuration files needed for you to use Packwerk.
The Packwerk team will be maintaining the gem and we’re stoked to see how you will be using the tool. You are also welcome to report bugs and open pull requests in accordance with our contribution guidelines.
Credits
Packwerk is inspired by Stripe’s internal Ruby packages solution with its idea adapted to the more complex world of Rails applications.
ShipIt! Presents: Packwerk by Shopify
Without code boundaries in a monolith, it’s difficult for developers to make changes in their respective areas. Like when you make a straightforward change that shockingly results in breaking unrelated tests in a different part of the codebase, or dig around a codebase to find a class or module with more than 2,000 lines of code!
You end up with anti-patterns like spaghetti code and large classes that know too much. The codebase is harder to develop, maintain and understand, leading to difficulty adding new features. It’s frustrating for developers working on the codebase. Developer happiness and productivity is important to us.
So, we created an open source tool to establish code boundaries in Rails applications. We call it Packwerk.
Wherever you are, your next journey starts here! If building systems from the ground up to solve real-world problems interests you, our Engineering blog has stories about other challenges we have encountered. Intrigued? Visit our Engineering career page to find out about our open positions and learn about Digital by Default.
Ruby on Rails is a great framework for rapidly building beautiful web applications that users and developers love. But if an application is successful, there’s usually continued investment, resulting in additional features and increased overall system complexity.
Shopify’s core monolith has over 2.8 million lines of Ruby code and 500,000 commits. Rails doesn’t provide patterns or tooling for managing the inherent complexity and adding features in a structured, well-bounded way.
That’s why, over three years ago, Shopify founded a team to investigate how to make our Rails monoliths more modular. The goal was to help us scale towards ever increasing system capabilities and complexity by creating smaller, independent units of code we called components. The vision went like this:
We can more easily onboard new developers to just the parts immediately relevant to them, instead of the whole monolith.
Instead of running the test suite on the whole application, we can run it on the smaller subset of components affected by a change, making the test suite faster and more stable.
Instead of worrying about the impact on parts of the system we know less well, we can change a component freely as long as we’re keeping its existing contracts intact, cutting down on feature implementation time.
In summary, developers should feel like they are working on a much smaller app than they actually are.
It’s been 18 months since we last shared our efforts to make our Rails monoliths more modular. I’ve been working on this modularity effort for the last two and a half years, currently on a team called Architecture Patterns. I’ll lay out the current state of my team’s work, and some things we’d do differently if we started fresh right now.
The Status Quo
We generally stand by the original ideas as described in Deconstructing the Monolith, but almost all of the details have changed. We make consistent progress, but it's important to note that making changes at this scale requires a significant shift in thinking for a critical mass of contributors, and that takes time.
While we’re far from finished, we already reap the benefits of our work. The added constraints on how we write our code trigger deep software design discussions throughout the organization. We see a mindset shift across our developers with a stronger focus on modular design. When making a change, developers are now more aware of the consequences on the design and quality of the monolith as a whole. That means instead of degrading the design of existing code, new feature implementations now more often improve it. Parts of the codebase that received heavy refactoring in recent years are now easier to understand because their relationship with the rest of the system is clearer.
We automatically triage exceptions to components, enabling teams to act on them without having to dig through the sometimes noisy exception stream for the whole monolith. And with each component explicitly owned by a team, whole-codebase chores like Rails upgrades are easily distributed and collaboratively solved. Shopify is running its main monolith on the newest, unreleased revisions of Rails. The clearly defined ownership for areas of the codebase is one of the factors enabling us to do that.
What We Learned so Far
Our main monolith is one of the oldest, largest Rails codebases on the planet, under continuous development since at least 2006, with hundreds of developers currently adding features.
A refactor on this scale needs to be approached completely differently from smaller efforts. We learned that all large scale changes start
with understanding and influencing developer behavior
at the grassroots
with a holistic perspective on architecture
with careful application of tooling
with being aware of the tradeoffs involved
Understand Developer Behaviour
A single centralized team can’t make change happen by working against the momentum of hundreds of developers adding features.
Also, it can’t anticipate all the edge cases and have context on all domains of the application. A single team can make simple change happen on a large scale, or complex change on a small scale. To modularize a large monolith though, we need to make complex change happen on a large scale. Even if a centralized team could make it happen, the design would degrade once the team switches its focus to something else.
That’s why making a fundamental architecture change to a system that’s being actively worked on is in large part a people problem. We need to change the behavior of the average developer on the codebase. We need to all iteratively evolve the system towards the envisioned future together. The developers are an integral part of the system.
Dr. B.J. Fogg, founder of the Behavior Design Lab at Stanford University, developed a model for thinking about behaviors that matches our experiences. The model suggests that for a behavior to occur, three things need to be in place: Ability, Motivation, and Prompt.
Fogg Behaviour Model by BJ Fogg, PHD
In a nutshell, prompts are necessary for a desired behavior to happen, but they're ineffective unless there's enough motivation and ability. Exceptionally high motivation can, within reason, compensate for low ability and vice versa.
Automated tooling and targeted manual code reviews provide prompts. That’s the easy part. Creating ability and motivation to make positive change is harder. Especially when that goes against common Ruby on Rails community practices and requires a view of the system that’s much larger than the area that most individual developers are working on. Spreading an understanding of what we’re aiming for, and why, is critical.
For example, we invested quite a bit of time and energy into developing patterns to ensure some consistency in how component boundary interfaces are designed. Again and again we pondered: How should components call each other? We then pushed developers to use these patterns everywhere. In hindsight, this strategy didn’t increase developer ability or motivation. It didn’t solve the problems actually holding them back, and it didn’t explain the reasons or long term goals well enough. Pushing for consistency added rules, which always add some friction, because they have to be learned, remembered, and followed. It didn’t make any hard problem significantly easier to solve. In some cases, the patterns were helpful. In other cases, they lead developers to redefine their problem to fit the solution we provided, which degraded the overall state of the monolith.
Today, we’re still providing some general suggestions on interface consistency, but we have a lot less hard rules. We’re focusing on finding the areas where developers are hungry to make positive change, but don’t end up doing it because it’s too hard. Often, making our code more modular is hard because legacy code and tooling are based on assumptions that no longer hold true. One of the most problematic outdated assumptions is that all Active Record models are OK to access everywhere, when in this new componentized world we want to restrict their usage to the component that owns them. We can help developers overcome this problem.
So in the words of Dr. Fogg, these days we’re looking for areas where the prompt is easy, the motivation is present, and we just have to amp up the ability to make things happen.
Foster the Grassroots
As I mentioned, we, as a centralized team, can’t make this change happen by ourselves. So, we work to create a grassroots movement among the developers at Shopify. We aim to increase the number of people that have ability, motivation and prompt to move the system a tiny step further in the right direction.
We give internal talks, write documentation, share wins, embed in other teams, and pair with people all over the company. Embedding and pairing make sure we’re solving the problems that product developers are most struggling with in practice, avoiding what’s often called Ivory Tower Syndrome where the solutions don’t match the problems. It also lets us gain context on different areas of the codebase and the business while helping motivated people achieve goals that align with ours.
As an example, we have a group called the Architecture Guild. The guild has a slack channel for software architecture discussions and bi-weekly meetups. It’s an open forum, and a way to grow more architecture conscious mindsets while encouraging architectural thinking. The Architecture Patterns team provides some content that we think is useful, but we encourage other people to share their thoughts, and most of the contributions come from other teams. Currently, the Architecture Guild has ~400 members and 54 documented meetups with meeting notes and recordings that are shared with all developers at Shopify.
The Architecture Guild grew organically out of the first Componentization team at Shopify after the first year of Componentization. If I were to start a similar effort again today, I’d establish a forum like this from the beginning to get as many people on board with the change as early as possible. It’s also generally a great vehicle to spread software design knowledge that’s siloed in specific teams to other parts of the company.
Other methods we use to create fertile ground for ambitious architecture projects are
the Developer Handbook, an internal online resource documenting how we develop software at Shopify.
Developer Talks, our internal weekly livestreamed and recorded talks about software development at Shopify.
Build Holistic Architecture
Some properties of software are so closely related that they need to be approached in pairs. By working on one property and ignoring its “partner property,” you could end up degrading the system.
Balance Encapsulation With A Simple Dependency Graph
We started out by focusing our work on building a clean public interface around each component to hide the internals. The expectation was that this would allow reasoning about and understanding the behavior of a component in isolation. Changing internals of a component wouldn’t break other components—as long as the interface stays stable.
It’s not that straightforward though. The public interface is what other components depend on; if a lot of components depend on it, it’s hard to change. The interface needs to be designed with those dependencies in mind, and the more components depend on it, the more abstract it needs to be. It’s hard to change because it’s used everywhere, and it will have to change often if it contains knowledge about concrete parts of the business logic.
When we started analyzing the graph of dependencies between components, it was very dense, to the point that every component depended on over half of all the other components. We also had lots of circular dependencies.
Circular Dependancies
Circular dependencies are situations where for example component A depends on component B but component B also depends on component A. But circular dependencies don’t have to be direct, the cycles can be longer than two. For example, A depends on B depends on C depends on A.
These properties of the dependency graph mean that the components can’t be reasoned about, or evolved, separately. Changes to any component in a cycle can break all other components in the cycle. Changes to a component that has almost all other components depend on can break almost all other components. So these changes require a lot of context. A dense, cyclical dependency graph undermines the whole idea of Componentization—it blocks us from making the system feel smaller.
When we ignored the dependency graph, in large parts of the codebase the public interface turned out to just be an added layer of indirection in the existing control flows. This made it harder to refactor these control flows because it added additional pieces that needed to be changed. It also didn’t make it a lot easier to reason about parts of the system in isolation.
The simplest possible way to introduce a public interface to a private implementation
The diagram shows that the simplest possible way to introduce a public interface could just mean that a previously problematic design is leaked into a separate interface class, making the underlying design problem harder to fix by spreading it into more files.
Discussions about the desirable direction of a dependency often surface these underlying design problems. We routinely discover objects with too many responsibilities and missing abstractions this way.
Perhaps not surprisingly, one of the central entities of the Shopify system is the Shop and so almost everything depends on the Shop class. That means that if we want to avoid circular dependencies, the Shop class can depend on almost nothing.
Luckily, there are proven tools we can use to straighten out the dependency graph. We can make arrows point in different directions, by either moving responsibilities into the component that depends on them or applying inversion of control. Inversion of control means to invert a dependency in such a way that control flow and source code dependency are opposed. This can be done for example through a publish/subscribe mechanism like ActiveSupport::Notifications.
This strategy of eliminating circular dependencies naturally guides us towards removing concrete implementation from classes like Shop, moving it towards a mostly empty container holding only the identity of a shop and some abstract concepts.
If we apply the aforementioned techniques while building out the public interfaces, the result is therefore much more useful. The simplified graph allows us to reason about parts of the system in isolation, and it even lays out a path towards testing parts of the system in isolation.
Dependencies diagram between Platform, Supporting, and Frontend components
If determining the desired direction of all the dependencies on a component ever feels overwhelming, we think about the components grouped into layers. This allows us to prioritize and focus on cleaning up dependencies across layers first. The diagram above sketches out an example. Here, we have platform components, Platform and Shop Identity, that purely provide functionality to other components. Supporting components, like Merchandising and Inventory, depend on the platform components but also provide functionality to others and often serve their own external APIs. Frontend components, like Online Store, are primarily externally facing. The dependencies crossing the dotted lines can be prioritized and cleaned up first, before we look at dependencies within a layer, for example between Merchandising and Inventory.
Balance Loose Coupling With High Cohesion
Tight coupling with low cohesion and loose coupling with high cohesion
Meaningful boundaries like those we want around components require loose coupling and high cohesion. A good approximation for this is Change Locality: The degree to which code that changes together lives together.
At first, we solely focused on decoupling components from each other. This felt good because it was an easy, visible change, but it still left us with cohesive parts of the codebase that spanned across component boundaries. In some cases, we reinforced a broken state. The consequence is that often small changes to the functionality of the system still meant changes in code across multiple components, for which the developers involved needed to know and understand all of those components.
Change Locality is a sign of both low coupling and high cohesion and makes evolving the code easier. The codebase feels smaller, which is one of our stated goals. And Change Locality can also be made visible. For example, we are working on automation analyzing all pull requests on our codebase for which components they touch. The number of components touched should go down over time.
An interesting side note here is that different kinds of cohesion exist. We found that where our legacy code respects cohesion, it’s mostly informational cohesion—grouping code that operates on the same data. This arises from a design process that starts with database tables (very common in the Rails community). Change Locality can be hindered by that. To produce software that is easy to maintain, it makes more sense to focus on functional cohesion—grouping code that performs a task together. That’s also much closer to how we usually think about our system.
Our focus on functional cohesion is already showing benefits by making our business logic, the heart of our software, easier to understand.
Create a SOLID foundation
There are ideas in software design that apply in a very similar way on different levels of abstraction—coupling and cohesion, for example. We started out applying these ideas on the level of components. But most of what applies to components, which are really large groups of classes, also applies on the level of individual classes and even methods.
On a class level, the most relevant software design ideas are commonly summarized as the SOLID principles. On a component level, the same ideas are called “package principles.” Here’s a SOLID refresher from Wikipedia:
Single-responsibility principle
A class should only have a single responsibility, that is, only changes to one part of the software's specification should be able to affect the specification of the class.
Open–closed principle
Software entities should be open for extension, but closed for modification.
Liskov substitution principle
Objects in a program should be replaceable with instances of their subtypes without altering the correctness of that program.
Interface segregation principle
Many client-specific interfaces are better than one general-purpose interface.
Dependency inversion principle
Depend upon abstractions, not concretions.
The package principles express similar concerns on a different level, for example (source):
Common Closure Principle
Classes that change together are packaged together.
Stable Dependencies Principle
Depend in the direction of stability.
Stable Abstractions Principle
Abstractness increases with stability.
We found that it’s very hard to apply the principles on a component level if the code doesn’t follow the equivalent principles on a class and method level. Well designed classes enable well designed components. Also, people familiar with applying the SOLID principles on a class level can easily scale these ideas up to the component level.
So if you’re having trouble establishing components that have strong boundaries, it may make sense to take a step back and make sure your organization gets better at software design on a scale of methods and classes first.
This is again mostly a matter of changing people’s behavior that requires motivation and ability. Motivation and ability can be increased by spreading awareness of the problems and approaches to solving them.
In the Ruby world, Sandi Metz is great at teaching these concepts. I recommend her books, and we’re lucky enough to have her teach workshops at Shopify repeatedly. She really gets people excited about software design.
Apply Tooling Deliberately
To accelerate our progress towards the modular monolith, we’ve made a few major changes to our tooling based on our experience so far.
Use Rails Engines
While we started out with a lot of custom code, our components evolved to look more and more like Rails Engines. We’re doubling down on engines going forward. They are the one modularity mechanism that comes with Rails out of the box. They have the familiar looks and features of Rails applications, but other than apps, we can run multiple engines in the same process. And should we make the decision to extract a component from the monolith, an engine is easily transformed into a standalone application.
Engines don’t fit the use case perfectly though. Some of the roughest edges are related to libraries and tooling assuming a Rails application structure, not the slightly different structure of an engine. Others relate to the fact that each engine can (and probably should) specify its own external gem dependencies, and we need a predictable way to unify them into one set of gems for the host application. Thankfully, there are quite a few resources out there from other projects encountering similar problems. Our own explorations have yielded promising results with multiple production applications currently using engines for modularity, and we’re using engines everywhere going forward.
Define and Enforce Contracts
Strong boundaries require explicit contracts. Contracts in code and documentation allow developers to use a component without reading its implementation, making the system feel smaller.
Initially, we built a hash schema validation library called Component::Schema based on dry-schema. It served us well for a while, but we ran into problems keeping up with breaking changes and runtime performance for checking more complex contracts.
In 2019, Stripe released their static Ruby type checker, Sorbet. Shopify was involved in its development before that release and has a team contributing to Sorbet, as we are using it heavily. Now it’s our go-to tool for expressing input and output contracts on component boundaries. Configured correctly, it has barely any runtime performance impact, it’s more stable, and it provides advanced features like interfaces.
This is what an entrypoint into a component looks like using Component::Schema:
And this is what that entrypoint looks like today, using Sorbet:
Perform Static Dependency Analysis
As Kirsten laid out in the original blog post on Componentization at Shopify, we initially built a call graph analysis tool we called Wedge. It logged all method calls during test suite execution on CI to detect calls between components.
We found the results produced were often not useful. Call graph logging produces a lot of data, so it’s hard to separate the signal from the noise. Sometimes it’s not even clear which component a call is from or to. Consider a method defined in component A which is inherited by a class in component B. If this method is making a call to component C, which component is the call coming from? Also, because this analysis depended on the full test suite with added instrumentation, it took over an hour to run, which doesn’t make for a useful feedback cycle.
So, we developed a new tool called Packwerk to analyze static constant references. For example, the line Shop.first, contains a static reference to Shop and a method call to a method on that class that’s called first. Packwerk only analyzes the static constant reference to Shop. There’s less ambiguity in static references, and because they’re always explicitly introduced by developers, highlighting them is more actionable. Packwerk runs a full analysis on our largest codebase in a few minutes, so we’re able to integrate it with our Pull Request workflow. This allows us to reject changes that break the dependency graph or component encapsulation before they get merged into our main branch.
We’re planning to make Packwerk open source soon. Stay tuned!
Decide to Prioritize Ownership or Boundaries
There are two major ways to partition an existing monolith and create components from a big ball of mud. In my experience, all large architecture changes end up in an incomplete state. Maybe that’s a pessimistic view, but my experience tells me that the temporary incomplete state will at least last longer than you expect. So choose an approach based on which intermediary state is most useful for your specific situation.
One option is to draw lines through the monolith based on some vision of the future and strengthen those lines over time into full fledged boundaries. The other option is to spin off parts of it into tiny units with strong boundaries and then transition responsibilities over iteratively, growing the components over time.
For our main monolith, we took the first approach; our vision was guided by the ideas of Domain Driven Design. We defined components as implementations of subdomains of the domain of commerce, and moved the files into corresponding folders. The main advantage is that even though we’re not finished building out the boundaries, responsibilities are roughly grouped together, and every file has a stewardship team assigned. The disadvantage is that almost no component has a complete, strong boundary yet, because with the components containing large amounts of legacy code, it’s a huge amount of work to establish these. This vision of the future approach is good if well-defined ownership and a clearly visible partition of the app are most important for you—which they were for us because of the huge number of people working on the codebase.
On other large apps within Shopify, we’ve tried out the second approach. The advantage is that large parts of the codebase are in isolated and clean components. This creates good examples for people to work towards. The disadvantage of this approach is that we still have a considerable sized ball of mud within the app that has no structure whatsoever. This spin-off approach is good if clean boundaries are the priority for you.
What We’re Building Right Now
While feature development on the monolith is going on as fast as ever, many developers are making things more modular at the same time. We see an increase of people in a position to do this, and the number of good examples around the codebase is expanding.
We currently have 37 components in our main monolith, each with public entrypoints covering large parts of its responsibilities. Packwerk is used on about a third of the components to restrict their dependencies and protect the privacy of their internal implementation. We’re working on making Packwerk enticing enough that all components will adopt it.
Through increased adoption we’re progressively enforcing properties of the dependency graph. Total acyclicity is the long term goal, but the more edges we can remove from the graph in the short term the easier the system will be to reason about.
We have a few other monolithic apps going through similar processes of componentization right now; some with the goal of splitting into separate services long term, some aiming for the modular monolith. We are very deliberate about when to split functionality out into separate services, and we only do it for good reasons. That’s because splitting a single monolithic application into a distributed system of services increases the overall complexity considerably.
For example, we split out storefront rendering because it’s a read-only use case with very high throughput and it makes sense for us to scale and distribute it separately from the interface that our merchants use to manage their stores. Credit card vaulting is a separate service because it processes sensitive data that shouldn’t flow through other parts of the system.
In addition, we’re preparing to have all new Rails applications at Shopify componentized by default. The idea is to generate multiple separately tested engines out of the box when creating a Rails app, removing the top level app folder and setting up developers for a modular future from the start.
At the same time, we’re looking into some of the patterns necessary to unblock further adoption of Packwerk. First and foremost that means making the dependency graph easy to clean up. We want to encourage inversion of control and more generally dependency inversion, which will probably lead us to use a publish/subscribe mechanism instead of straightforward method calls in many cases.
The second big blocker is efficiently querying data across components without coupling them too tightly. The most interesting problems in this area are
Our GraphQL API exposes a partially circular graph to external consumers while we’d like the implementation in the components to be acyclic.
Our GraphQL query execution and ElasticSearch reindexing currently heavily rely on Active Record features, which defeats the “public interface, private implementation” idea.
The long term vision is to have separate, isolated test suites for most of the components of our main monolith.
Last But Not Least
I want to give a shout out to Josh Abernathy, Bryana Knight, Matt Todd, Matthew Clark, Mike Chlipala and Jakob Class at Github. This blog post is based on, and indirectly the result of a conversation I had with them. Thank you!
Anita Clarke, Edward Ocampo-Gooding, Gannon McGibbon, Jason Gedge, Martin LaRochelle, and Keyfer Mathewson contributed super valuable feedback on this article. Thank you BJ Fogg for the behavior model and use of your image.
If you’re interested in the kinds of challenges I described, you should join me at Shopify!
On July 17, 2020, ShipIt!, our monthly event series, presented A Look at Shopify's API Health Report. Our guests, Shuting Chang, Robert Saunders, Karen Xie, and Vrishti Dutta join us to talk about Shopify’s API Health Report, the tool, this multidisciplinary team, built to surface breaking changes affecting Shopify Partner apps.
Additional Information
The links shared to the audience during the event:
If building systems from the ground up to solve real-world problems interests you, our Engineering blog has stories about other challenges we have encountered. Visit our Engineering career page to find out about our open positions.
In January 2019, we set out to rewrite the critical software that powers all online storefronts on Shopify’s platform to offer the fastest online shopping experience possible, entirely from scratch and without downtime.
The Storefront Renderer is a server-side application that loads a Shopify merchant's storefront Liquid theme, along with the data required to serve the request (for example product data, collection data, inventory information, and images), and returns the HTML response back to your browser. Shaving milliseconds off response time leads to big results for merchants on the platform as buyers increasingly expect pages to load quickly, and failing to deliver on performance can hinder sales, not to mention other important signals like SEO.
The previous storefront implementation‘s development, started over 15 years ago when Tobi launched Snowdevil, lived within Shopify’s Ruby on Rails monolith. Over the years, we realized that the “storefront” part of Shopify is quite different from the other parts of the monolith: it has much stricter performance requirements and can accept more complexity implementation-wise to improve performance, whereas other components (such as payment processing) need to favour correctness and readability.
In addition to this difference in paradigm, storefront requests progressively became slower to compute as we saw more storefront traffic on the platform. This performance decline led to a direct impact on our merchant storefronts’ performance, where time-to-first-byte metrics from Shopify servers slowly crept up as time went on.
Here’s how the previous architecture looked:
Old Storefront Implementation
Before, the Rails monolith handled almost all kinds of traffic: checkout, admin, APIs, and storefront.
With the new implementation, traffic routing looks like this:
New Storefront Implementation
The Rails monolith still handles checkout, admin, and API traffic, but storefront traffic is handled by the new implementation.
Designing the new storefront implementation from the ground up allowed us to think about the guarantees we could provide: we took the opportunity of this evergreen project to set us up on strong primitives that can be extended in the future, which would have been much more difficult to retrofit in the legacy implementation. An example of these foundations is the decision to design the new implementation on top of an active-active replication setup. As a result, the new implementation always reads from dedicated read replicas, improving performance and reducing load on the primary writers.
Similarly, by rebuilding and extracting the storefront-related code in a dedicated application, we took the opportunity to think about building the best developer experience possible: great debugging tools, simple onboarding setup, welcoming documentation, and so on.
Finally, with improving performance as a priority, we work to increase resilience and capacity in high load scenarios (think flash sales: events where a large number of buyers suddenly start shopping on a specific online storefront), and invest in the future of storefront development at Shopify. The end result is a fast, resilient, single-purpose application that serves high-throughput online storefront traffic for merchants on the Shopify platform as quickly as possible.
Defining Our Success Criteria
Once we clearly outlined the problem we’re trying to solve and scoped out the project, we defined three main success criteria:
Establishing feature parity: for a given input, both implementations generate the same output.
Improving performance: the new implementation runs on active-active replication setup and minimizes server response times.
Improving resilience and capacity: in high-load scenarios, the new implementation generally sustains traffic without causing errors.
Building A Verifier Mechanism
Before building the new implementation, we needed a way to make sure that whatever we built would behave the same way as the existing implementation. So, we built a verifier mechanism that compares the output of both implementations and returns a positive or negative result depending on the outcome of the comparison.
This verification mechanism runs on storefront traffic in production, and it keeps track of verification results so we can identify differences in output that need fixing. Running the verifier mechanism on production traffic (in addition to comparing the implementations locally through a formal specification and a test suite) lets us identify the most impactful areas to work on when fixing issues, and keeps us focused on the prize: reaching feature parity as quickly as possible. It’s desirable for multiple reasons:
giving us an idea of progress and spreading the risk over a large amount of time
shortening the period of time that developers at Shopify work with two concurrent implementations at once
providing value to Shopify merchants as soon as possible.
There are two parts to the entire verifier mechanism implementation:
A verifier service (implemented in Ruby) compares the two responses we provide and returns a positive or negative result depending on the verification outcome. Similar to a `diff` tool, it lets us identify differences between the new and legacy implementations.
A custom nginx routing module (implemented in Lua on top of OpenResty) sends a sample of production traffic to the verifier service for verification. This module acts as a router depending on the result of the verifications for subsequent requests.
The following diagram shows how each part interacts with the rest of the architecture:
Legacy implementation and new implementation at the same conceptual layer
The legacy implementation (the Rails monolith) still exists, and the new implementation (including the Verifier service) is introduced at the same conceptual layer. Both implementations are placed behind a custom routing module that decides where to route traffic based on the request attributes and the verification data for this request type. Let’s look at an example.
When a buyer’s device sends an initial request for a given storefront page (for example, a product page from shop XYZ), the request is sent to Shopify’s infrastructure, at which point an nginx instance handles it. The routing module considers the request attributes to determine if other shop XYZ product page requests have previously passed verification.
First request routed to Legacy implementation
Since this is the first request of this kind in our example, the routing module sends the request to the legacy implementation to get a baseline reference that it will use for subsequent shop XYZ product page requests.
Routing module sends original request and legacy implementation’s response to the new implementation
Once the response comes back from the legacy implementation, the Lua routing module sends that response to the buyer. In the background, the Lua routing module also sends both the original request and the legacy implementation’s response to the new implementation. The new implementation computes a response to the original request and feeds both its response and the forwarded legacy implementation’s response to the verifier service. This is done asynchronously to make sure we’re not adding latency to responses we send to buyers, who don’t notice anything different.
At this point, the verifier service received the responses from both the legacy and new implementations and is ready to compare them. Of course, the legacy implementation is assumed to be correct as it’s been running in production for years now (it acts as our reference point). We keep track of differences between the two implementations’ responses so we can debug and fix them later. The verifier service looks at both responses’ status code, headers, and body, ensuring they’re equivalent. This lets us identify any differences in the responses so we make sure our new implementation behaves like the legacy one.
Time-related and randomness-related exceptions make it impossible to have exactly byte-equal responses, so we ignore certain patterns in the verifier service to relax the equivalence criteria. The verifier service uses a fixed time value during the comparison process and sets any random values to a known value so we reliably compare the outputs containing time-based and randomness-based differences.
The verifier service sends comparison result back to the Lua module
The verifier service sends the outcome of the comparison back to the Lua module, which keeps track of that comparison outcome for subsequent requests of the same kind.
Dynamically Routing Requests To the New Implementation
Once we had verified our new approach, we tested rendering a page using the new implementation instead of the legacy one. We iterated upon our verification mechanism to allow us to route traffic to the new implementation after a given number of successful verifications. Here’s how it works.
Just like when we only verified traffic, a request arrives from a client device and hits Shopify’s architecture. The request is sent to both implementations, and both outputs are forwarded to the verifier service for comparison. The comparison result is sent back to the Lua routing module, which keeps track of it for future requests.
When a subsequent storefront request arrives from a buyer and reaches the Lua routing module, it decides where to send it based on the previous verification results for requests similar to the current one (based on the request attributes
For subsequent storefront requests, the Lua routing module decides where to send it
If the request was verified multiple times in the past, and nearly all outcomes from the verifier service were “Pass”, then we consider the request safe to be served by the new implementation.
If most verifier service results are “Pass”, then it uses the new implementation
If, on the other hand, some verifications failed for this kind of request, we’ll play it safe and send the request to the legacy implementation.
If most verifier service results are “Fail”, then it uses the old implementation
Successfully Rendering In Production
With the verifier mechanism and the dynamic router in place, our first goal was to render one of the simplest storefront pages that exists on the Shopify platform: the password page that protects a storefront before the merchant makes it available to the public.
Once we reached full parity for a single shop’s password page, we tested our implementation in production (for the first time) by routing traffic for this password page to the new implementation for a couple of minutes to test it out.
Success! The new implementation worked in production. It was time to start implementing everything else.
Increasing Feature Parity
After our success with the password page, we tackled the most frequently accessed storefront pages on the platform (product pages, collection pages, etc). Diff by diff, endpoint by endpoint, we slowly increased the parity rate between the legacy and new implementations.
Having both implementations running at the same time gave us a safety net to work with so that if we introduced a regression, requests would easily be routed to the legacy implementation instead. Conversely, whenever we shipped a change to the new implementation that would fix a gap in feature parity, the verifier service starts to report verification successes, and our custom routing module in nginx automatically starts sending traffic to the new implementation after a predetermined time threshold.
Defining “Good” Performance with Apdex Scores
We collected Apdex (Application Performance Index) scores on server-side processing time for both the new and legacy implementations to compare them.
To calculate Apdex scores, we defined a parameter for a satisfactory threshold response time (this is the Apdex’s “T” parameter). Our threshold response time to define a frustrating experience would then be “above 4T” (defined by Apdex).
We defined our “T” parameter as 200ms, which lines up with Google’s PageSpeed Insights recommendation for server response times. We consider server processing time below 200ms as satisfying and a server processing time of 800ms or more as frustrating. Anything in between is tolerated.
From there, calculating the Apdex score for a given implementation consists of setting a time frame, and counting three values:
N, the total number of responses in the defined time frame
S, the number of satisfying responses (faster than 200ms) in the time frame
T, the number of tolerated responses (between 200ms and 800ms) in the time frame
Then, we calculate the Apdex score:
By calculating Apdex scores for both the legacy and new implementations using the same T parameter, we had common ground to compare their performance.
Methods to Improve Server-side Storefront Performance
We want all Shopify storefronts to be fast, and this new implementation aims to speed up what a performance-conscious theme developer can’t by optimizing data access patterns, reducing memory allocations, and implementing efficient caching layers.
Optimizing Data Access Patterns
The new implementation uses optimized, handcrafted SQL multi-select statements maximizing the amount of data transferred in a single round trip. We carefully vet what we eager-load depending on the type of request and we optimize towards reducing instances of N+1 queries.
Reducing Memory Allocations
We reduce the number of memory allocations as much as possible so Ruby spends less time in garbage collection. We use methods that apply modifications in place (such as #map!) rather than those that allocate more memory space (like #map). This kind of performance-oriented Ruby paradigm sometimes leads to code that’s not as simple as idiomatic Ruby, but paired with proper testing and verification, this tradeoff provides big performance gains. It may not seem like much, but those memory allocations add up quickly, and considering the amount of storefront traffic Shopify handles, every optimization counts.
Implementing Efficient Caching Layers
We implemented various layers of caching throughout the application to reduce expensive calls. Frequent database queries are partitioned and cached to optimize for subsequent reads in a key-value store, and in the case of extremely frequent queries, those are cached directly in application memory to reduce I/O latency. Finally, the results of full page renders are cached too, so we can simply serve a full HTTP response directly from cache if possible.
Measuring Performance Improvement Successes
Once we could measure the performance of both implementations and reach a high enough level of verified feature parity, we started migrating merchant shops. Here are some of the improvements we’re seeing with our new implementation:
Across all shops, average server response times for requests served by the new implementation are 4x to 6x faster than the legacy implementation. This is huge!
When migrating a storefront to the new implementation, we see that the Apdex score for server-side processing time improves by +0.11 on average.
When only considering cache misses (requests that can’t be served directly from the cache and need to be computed from scratch), the new implementation increases the Apdex score for server-side processing time by a full +0.20 on average compared to the previous implementation.
We heard back from merchants mentioning a 500ms improvement in time-to-first-byte metrics when the new implementation was rolled out to their storefront.
So another success! We improved store performance in production.
Now how do we make sure this translates to our third success criteria?
Improving Resilience and Capacity
While working on the new implementation, the Verifier service identified potential parity gaps, which helped tremendously. However, a few times we shipped code to production that broke in exceedingly rare edge cases that it couldn’t catch.
As a safety mechanism, we made it so that whenever the new implementation would fail to successfully render a given request, we’d fall back to the legacy implementation. The response would be slower, but at least it was working properly. We used circuit breakers in our custom nginx routing module so that we’d open the circuit and start sending traffic to the legacy implementation if the new implementation was having trouble responding successfully. Read more on tuning circuit breakers in this blog post by my teammate Damian Polan.
Increase Capacity in High-load Scenarios
To ensure that the new implementation responds well to flash sales, we implemented and tweaked two mechanisms. The first one is an automatic scaling mechanism that adds or removes computing capacity in response to the amount of load on the current swarm of computers that serve traffic. If load increases as a result of an increase in traffic, the autoscaler will detect this increase and start provisioning more compute capacity to handle it.
Additionally, we introduced in-memory cache to reduce load on external data stores for storefronts that put a lot of pressure on the platform’s resources. This provides a buffer that reduces load on very-high traffic shops.
Failing Fast
When an external data store isn’t available, we don’t want to serve buyers an error page. If possible, we’ll try to gracefully fall back to a safe way to serve the request. It may not be as fast, or as complete as a normal, healthy response, but it’s definitely better than serving a sad error page.
We implemented circuit breakers on external datastores using Semian, a Shopify-developed Ruby gem that controls access to slow or unresponsive external services, avoiding cascading failures and making the new implementation more resilient to failure.
Similarly, if a cache store isn’t available, we’ll quickly consider the timeout as a cache miss, so instead of failing the entire request because the cache store wasn’t available, we’ll simply fetch the data from the canonical data store instead. It may take longer, but at least there’s a successful response to serve back to the buyer.
Testing Failure Scenarios and the Limits of the New Implementation
Finally, as a way to identify potential resilience issues, the new implementation uses Toxiproxy to generate test cases where various resources are made available or not, on demand, to generate problematic scenarios.
As we put these resilience and capacity mechanisms in place, we regularly ran load tests using internal tooling to see how the new implementation behaves in the face of a large amount of traffic. As time went on, we increased the new implementation’s resilience and capacity significantly, removing errors and exceptions almost completely even in high-load scenarios. With BFCM 2020 coming soon (which we consider as an organic, large-scale load test), we’re excited to see how the new implementation behaves.
Where We’re at Currently
We’re currently in the process of rolling out the new implementation to all online storefronts on the platform. This process happens automatically, without the need for any intervention from Shopify merchants. While we do this, we’re adding more features to the new implementation to bring it to full parity with the legacy implementation. The new implementation is currently at 90%+ feature parity with the legacy one, and we’re increasing that figure every day with the goal of reaching 100% parity to retire the legacy implementation.
As we roll out the new implementation to storefronts we are continuing to see and measure performance improvements as well. On average, server response times for the new implementation are 4x faster than the legacy implementation. Rhone Apparel, a Shopify Plus merchant, started using the new implementation in April 2020 and saw dramatic improvements in server-side performance over the previous month.
We learned a lot during the process of rewriting this critical piece of software. The strong foundations of this new implementation make it possible to deploy it around the world, closer to buyers everywhere, to reduce network latency involved in cross-continental networking, and we continue to explore ways to make it even faster while providing the best developer experience possible to set us up for the future.
We're always on the lookout for talent and we’d love to hear from you. Visit our Engineering career page to find out about our open positions.
On June 20, 2020, ShipIt!, our monthly event series, presented AR/VR at Shopify. Daniel Beauchamp, Head of AR/VR at Shopify talked about how we’re using this increasingly ubiquitous technology at Shopify.
The missing Shopify AR Stroller in video in the AR/VR at Shopify presentation can be viewed athttps://youtu.be/ntX0cOr4r08
On July 20, 2020 we held ShipIt! Presents: AR/VR at Shopify. Daniel talked about what we’re doing with AR/VR at Shopify. The video of the event is available.
Size.link is a free tool built by Shopify’s Augmented Reality (AR) team that lets anyone view the size of a product in the space around them using their smartphone camera.
The tool came out of our April Hack Days focused on helping retailers impacted by Covid-19. Our idea was to create an easy way for merchants to show how big their products are—something that became increasingly important as retail stores were closed. While Shopify does support 3D models of products, it does take time and money to get 3D models made. We wanted to provide a quick stopgap solution.
The ideal flow is for merchants to provide a link on their product page (e.g., https://size.link?l=3&w=4&h=5&units=in) that would open up an AR view when someone clicked on it. For this to be as seamless as possible, it had to be all done on the web (no app required!), fast, accurate, and work on iOS and Android.
Let’s dive into how we pulled it off.
AR on the Web
3D on the web has been around for close to a decade. There are great WebGL libraries like Three.js that make it quick to display 3D content. For Size.link, all we needed to show was a 3D cube which is essentially the “Hello World” of computer graphics.
The problem is that WebAR, the ability to power AR experiences on the web with JavaScript, isn’t supported on iOS. In order to build fully custom AR experiences on iOS, it needs to be in an app.
Luckily, there’s a workaround. iOS has a feature called AR Quick Look, which is a native AR viewer built into the operating system. By opening a link to a 3D model file online, an AR viewer will launch right in your browser to let you view the model. Android has something similar called Scene Viewer. The functionality of both of these viewers is limited to only placing and moving a single 3D object in your space, but for Size.link that was all we needed.
Example of a link to view a 3D model with iOS AR Quick Look:
Example of a link to view a 3D model with Android Scene Viewer:
You might have noticed that the file extensions in the above viewers are different between Android and iOS. Welcome to the wonderful world of 3D formats!
A Quick Introduction to 3D File Formats
Image files store pixels, and 3D files store information about an object’s shape (geometry) and what it’s made of (materials & textures). Let’s take a look at a simple object: a cube. To represent a cube as a 3D model we need to know the positions of each of its corners. These points are called vertices
Left: Each vertex of the cube. Right: 3d-coordinates of each vertex
These can be represented in array like this:
We also need to know how each side of the cube is connected. These are called the faces.
A face made up of vertices 0, 1, 5, 4
The face array [0, 1, 5, 4] denotes that there’s a face made up by connecting vertices 0, 1, 5, and 4 together. Our full cube would look something like this:
There is also a scale property that lets us resize the whole object instead of moving the vertices manually. A scale of (1,2,3) would scale by 1 along the x-axis, 2 along the y-axis, and 3 along the z-axis.
A scale of (1,2,3) used to resize the whole object
So what file format can we use to store this information? Well, just like how images have different file formats (.jpeg, .png, .tiff, .bmp, etc), there’s more than one type of 3D format. And because the geometry data can get quite large, these formats are often binary instead of ASCII based.
Android’s Scene Viewer uses .glTF, which is quickly becoming a 3D standard in the industry. Its aim is to be the jpeg of 3D. The binary version of a .glTF file is a .glb file. Apple on the other hand is using their own format called USDZ, which is based off of Pixar’s USD file format.
For Size.link to work on both operating systems, we needed a way to create these files dynamically. When a user entered dimensions we’d have to serve them a 3D model of that exact size.
Approach 1: Creating 3D Models Dynamically
There are many libraries out there for creating and manipulating .glTF, and they’re very lightweight. You can use them client side or server side.
USDZ is a whole other story. It’s a real pain to compile all the tools, and an even bigger pain to get running on a server. Apple distributes precompiled executables, but they only work on OSX. We definitely didn’t want to spend half of Hack Days wrestling with tooling, but assuming we could get it working, the idea was:
Generate a cube as a .gltf file
Use the usdzconvert tool to convert the cube.gltf to a .usdz
The problem here is that this process could end up taking a non-trivial amount of time. We’ve seen usdzconvert take up to 3-4 seconds to convert, and if you add the time it takes to create the .gltf, users might be waiting 5 seconds or more before the AR view launches.
There had to be a faster and easier way.
Approach 2: Pre-generate All possible Models
What if we generated every possible combination of box beforehand in both .gltf and .usdz formats? Then when someone entered in their dimensions, we would just serve up the relevant file.
How many models would we need? Let’s say we limited sizes for width, length, and depth to be between 1cm and 1000cm. There’s likely not many products that are over 10 meters. We’d then have to pick how granular we could go. Likely people wouldn’t be able to visually tell the difference between 6.25cm and 6cm. So we’d go in increments of 25mm. That would require 4000 * 4000 * 4000 * 2, or 128,000,000,000 models. We didn’t really feel like generating that many models, nor did we have the time during Hack Days!
How about if we went in increments of 1cm? That would need 1000 * 1000 * 1000 * 2, or 2 billion models. That’s a lot. At 3 KB a model, that’s roughly 6TB of models.
This approach wasn’t going to work.
Approach 3: Modify the Binary Data Directly
All Size.link cubes have the same textures and materials, and the same numbers of vertices and faces. The only difference between them is their scale. It seemed inefficient to regenerate a new file every time just to change this one parameter, and seemed wasteful to pre-generate billions of almost identical files.
But what if we took the binary data of a .usdz file, found which bytes correspond to the scale property, and swapped them out with new values? That way we could bypass all of the usdz tooling.
The first challenge was to find the byte location of the scale values. The scale value (1, 1, 1) would be hard to look for because the value “1” likely comes up many times in the cube’s binary data. But if we scaled a cube with values that were unlikely to be elsewhere in the file, we could narrow down the location. We ended up creating a cube with scale = (1.7,1.7,1.7).
By loading up our file in a hex editor, we’re able to look up and find the value. USDZ stores values as 32-bit floats, so 1.7 is represented as 0x9a99d93f. With a quick search we found at byte offset 1344 the values corresponding to scale along the x, y, and z axes.
Identifying 0x9a99d93f within the USDZ binary
To test our assumption, the next step was to try changing these bytes and seeing that the scale would change.
It worked! With this script we could generate .usdz files on the fly and it was really fast.The best part is that this could also run completely client side with a few modifications. We could modify the .usdz in the browser, encode the data in a URL, and pass that URL to our AR Quick Look link:
Unfortunately, our dreams of running this script entirely on the client were dashed when it came to Android. Turns out you can’t launch Scene Viewer from a local data URL. The file has to be served somewhere, so we’re back to needing to do this on a server.
But before we went about refactoring this script to run on a little server written in Ruby, we wanted to give our lovely cube a makeover. The default material was this grey colour that looked a bit boring.
The new cube is semi-transparent and has a white outline that makes it easier to align with the room
Achieving the transparency effect was as simple as setting the opacity value of the material. The white outline proved to be a bit more challenging because it could easily get distorted with scale.
If one side of the cube is much longer than the other, the outline starts stretching
The outline starts stretching on the box
You can see in the above image how the outlines are no longer consistent in thickness. The ones of the sides are now twice as thick the others.
We needed a way to keep the outline thickness consistent regardless of the overall dimensions, and that meant that we couldn’t rely on scale. We’d have to modify the vertex positions individually.
Vertices are highlighted in red
Above is the structure of the new cube we landed on with extra vertices for the outline. Since we couldn’t rely on the scale property anymore for resizing our cube, we needed to change the byte values of each vertex in order to reposition them. But it seemed tedious to maintain a list of all the vertex byte offsets, so we ended up taking a “find and replace” approach.
We gave each x, y, z position of a vertex a unique value that we could search for in the byte array and replace. In this case the outer vertices for x, y, z were 51, 52, 53 respectively. We picked these numbers at random just like we picked the number 1.7 before. We wanted something unique.
Vertex values that affected the outline were 41, 42, and 43. Vertex positions with the same value meant that they moved together. Also, since the cube is symmetrical, we gave opposite vertices the same value except negated.
As an example, let’s say we wanted to make a cube 2m long, and 1m wide and tall. We’d first search for all the bytes with a float value of 51 (0x00004c42) and replace it with the value 2 * 0.5 = 1 (0x0000803f). We use 1 instead of 2 because of the vertices being symmetrical. If the left-most corner has a value of -1 and the right-most has a value of 1, then the distance between them is 2
Distance between the vertices is 2
We’d then move the outline vertices by looking for all the bytes with value 41 (0x00002442) and replace them with 1.98 * 0.5 = 0.99 (0xa4707d3f) to keep the outline 2cm thick. We’d repeat this process for the width and the height
The template cube is transformed to the proper dimensions with consistent outline thickness.
Here’s what part of our server side Ruby code ended up looking like to do this:
Et voilà! We now had a way to generate beautiful looking cubes on the fly. And most importantly, it’s blazingly fast.This new way can create usdz files in well under 1 millisecond, something much better than relying on the python USD toolset.
All that remained was to write the .glb version, which we did using the same approach as above.
What’s Next for Size.link?
We’re really happy with how Size.link turned out, and with the simplicity of its implementation. Now anytime you are shopping and want to see how big a product is, you can simply go to Size.link and visualize the dimensions.
But why stop at showing 3D cubes? There are lots of standard-sized products that we could help visualize like rugs, posters, frames, mattresses, etc—Imagine being able to upload a product photo of a 6x9 rug and instantly load it up in front of you in AR. All we need to figure out is how to dynamically insert textures into .usdz and .glb files.
Time to boot up the ol’ hex editor again…
We're always on the lookout for talent and we’d love to hear from you. Visit our Engineering career page to find out about our open positions.
The Shopify admin is a Ruby on Rails monolith that hundreds of developers work on, with a continuous deployment cycle used by millions of people.
Shopify recently launched the ability to add videos and 3d models to products as a native feature within the Admin section. This feature expands a merchant's ability to showcase their products through media using videos and 3d models in addition to the already existing images. Images have been around since the beginning of Shopify, and there are currently over 7 billion images on the platform.
A requirement of this project was to support the legacy image infrastructure while adding the new capabilities for all our merchants. In a large system like Shopify, it is critical to have control over the code and safe database operations. For this reason, at Shopify, transactions are used to make database writes safe.
One of the challenges we faced during the design of this project was deciding whether to use callbacks or a pipeline approach. The first approach we can take to implement the feature is a complete rails approach with callbacks and dependencies. Callbacks, as rails describes them, allow you to trigger logic during an object's life cycle.
“Callbacks are methods that get called at certain moments of an object's life cycle. With callbacks, it is possible to write code that will run whenever an Active Record object is created, saved, updated, deleted, validated, or loaded from the database.”
Media via Callbacks
Callbacks are quick and easy to set up. It is fast to hit the ground running. Let’s look at what this means for our project. For the simplest case of only one media type, i.e., image, we have an image object and a media object. The image object has a polymorphic association to media. Video and 3d models can be other media types. The code looks something like this:
With this setup, the creation process of an Image will look something like this:
We have to add a transaction during creation since we need both image and media records to exist. To add a bit more complexity to this example, we can add another media type, video, and expand beyond create. Video has unique aspects, such as the concept of a thumbnail that doesn’t exist for an image. This adds some conditionals to the models.
From the two previous examples, it is clear that getting started with callbacks is quick when the application is simple; however, as we add more logic, the code becomes more complex. We see that, even for a simple example like this one, our media object has granular information on the specifics of video and images. As we add more media types, we end up with more conditional statements and business logic spread across multiple models. In our case, using callbacks made it hard to keep track of the object’s lifecycle and the order in which callbacks are triggered during each state. As a result, it became challenging to maintain and debug the code.
Media via Pipelines
In an attempt to have better control over the code, we decided not to use callbacks and instead try an approach using pipelines. Pipeline is the concept where the output of one element is the input to the next. In our case, the output of one class is the input to the next. There is a separate class that is responsible for only one operation of a single media type.
Let’s imagine the whole system as a restaurant kitchen. The Entrypoint class is like the kitchen’s head chef. All the orders come to this person. In our case, the user input comes into this service (Product Create Media Service). Next, the head chef assigns the orders to her sous chef. This is the media create handler. The sous chef looks at the input and decides which of the kitchen staff get’s the order. She assigns the order for a key lime pie to the pastry chef and the order for roasted chicken to the roast chef. Similarly, the media create handler assigns the task to create a video to the video create handler and the task to create an image to the image create handler. Each of these individuals specializes in their tasks and are not aware of the details of others. The video create handler is only responsible for creating a media of type video. It has no information about image or 3d models.
All of our individual classes have the same structure but are responsible for different media types. Each class has three methods:
before_transaction
during_transaction
after_transaction
As the name suggests, these methods have to be called in that specific order. Going back to our analogy, the before transaction method is responsible for all the prep work that goes in before we create the food. The during transaction is everything involved in creating the dish, which involves cooking the dish and plating it. For rails, this is the method that is responsible for persisting the data to the database. Finally, after_transaction is the clean up that is required after each dish is created.
Let's look at what the methods do in our case. For example, the video create handler will look like this:
Similarly, if we move a step up, we can look at the media create handler. This handler will also follow a similar pattern with three methods. Each of these methods in turn calls the handler for the respective media type and creates a cascading effect.
Media Create Handler
The logic for each media type remains confined to its specific class. Each class is only aware of its operation, like how the example above is only concerned with creating a video. This creates a separation of concerns. Let's take a look at the product create media service. The service is unaware of the media type, and it’s only responsibility is to call the media handler.
Product Create Media Service
The product create media service also has a public entry point, which is used to call the service.
The caller of the service has a single entry point and is completely unaware of the specifics of how each media type is created. Like in a restaurant, we want to make sure that the food for an entire table is delivered together. Similarly, in our code, we can manage that interdependent objects are created together using a transaction. This approach gives us the following features:
Different components of the system can create media and manage their own transactions.
The system components no longer have access to the media models but can interact with them using the service entry point.
The media callbacks don't get fired with those of the caller, making it easier to follow the code. When developers new to rails use callbacks, it requires a lot of knowledge of the framework and hides away the implementation details.
This approach makes it easier to follow and debug the code. The cognitive load on the reader is low, they are all ruby objects, and it is easy to understand.
It also gives us control over the order in which objects are created, deleted, updated.
From the code example, we see that the methods of implementation using callbacks is quick and easy to set up. Ruby on rails can speed up the development process by abstracting away the implementation details, and it is a great feature to use when working with a simple use case. However, as the code evolves and grows more complex, It can be hard to maintain a large production application with callbacks. As we saw in the example above, we had conditionals spread across the active record models.
An alternate approach can better serve the purpose of long-term maintenance and understandability of the code. In our case, pipelines helped achieve this. We separated the business logic in separate files, enabling us to understand the implementation details better. It also avoided having conditionals spread across the active record models. The most significant advantage of the approach is that it created a clear separation of concerns and different parts of the application do not know the particulars of the media component.
When designing a pipeline it is important to make sure that there is a single entry point that can be used by the consumer. The pipeline should only perform the actions it is expected to and not have side effects. For example, our pipeline is responsible for creating media and no other action, the client does not expect any other product attribute to be modified. Pipelines are designed to make it easy for the caller to perform certain tasks and so we hide away the implementation details of creating media from the caller. And finally having several steps that perform smaller subtasks can create a clear separation of concern within the pipeline.
We're always on the lookout for talent and we’d love to hear from you. Visit our Engineering career page to find out about our open positions.
Hey, I’m Jay and I recently finished my first internship at Shopify as a Backend Developer Intern on the App Store Ads team. Out of all my contributions to the ad platform, I wanted to talk about one that has takeaways for any Ruby developer. Here are four reasons for why we adopted Sorbet for static type checking in our repository.
1. Type-safe Method Calls
Let’s take a look at an example.
On the last line we call the method action and then call value.to_h on its return type. If action returns nil, calling value.to_h will cause an undefined method error.
Without a unit test covering the case when action returns nil, such code could go by undetected. To make matters worse, what if foo() is overridden by a child class to have a different return type? When types are inferred from the names of variables such as in the example, it is hard for any new developer to know that their code needs to handle different return types. There is no clue to suggest what result contains, so the developer would have to search the entire code base for what it could be.
Let’s see the same example with method signatures.
In the revised example, it’s clear from the signature that `action` returns a Result object or nil. Sorbet type checking will raise an error to say that calling action.value.to_h is invalid because action can potentially return nil. If Sorbet doesn’t raise any errors regarding our method, we deduce that foo() returns a Result object, as well as an object (most likely an array) that we can call empty? on. Overall, method annotations give us additional clarity and safety. Now, instead of writing trivial unit tests for each case, we let Sorbet check the output for us.
2. Type-safety for Complex Data Types
When passing complex data types around, it’s easy to use hashes such as the following:
This approach has a few concerns:
:id and :score may not be defined properties until the object is created in the database. If they’re not properties, calling ad.id or ad.score on the ad object will return nil, which is unexpected behavior in certain contexts.
:state may be intended to be an enum. There are no runtime checks that ensure that a value such as running isn't accidentally put in the hash.
:start_date has a value, but :end_date is nil. Can they both be nil? Will the :start_date always have a value? We don’t know without looking at the code that generated the object.
Situations like this put a large onus on the developer to remember all the different variants of the hash and the contexts in which particular variants are used. It’s very easy for a developer to make a mistake by trying to access a key that doesn’t exist or assign the incorrect value to a key. Fortunately, Sorbet helps us solve these problems.
Consider the example of creating an ad:
Creating an ad
Input data flows from an API request to the database through some layers of code. Once stored, a database record is returned.
Here we define typed Sorbet structs for the input data and the output data. A Database::Ad extends an Input::Ad by additionally having an :id and :score.
Each of the previous concerns have been addressed:
:id and :score clearly do not exist on ads being sent to the database as inputs, but definitely exist on ads being returned.
:state must be a State object (as an aside, we implement these using Sorbet enums), so invalid strings cannot be assigned to :state.
:end_date can be nil, but :start_date will never be nil.
Any failure to obey these rules will raise errors during static type checking by Sorbet, and it is clear to developers what fields exist on our object when it’s being passed through our code.
To extend beyond the scope of this article, we use GraphQL to specify type contracts between services. This lets us guarantee that ad data sent to our API will parse correctly into Input::Ad objects.
3. Type-safe Polymorphism and Duck Typing
Sorbet interfaces are integral to implementing the design patterns used in the Ad Platform repository. We’re committed to following a Hexagonal Structure with dependency injection:
Hexagonal Structure with dependency injection
When we get an incoming request, we first compose a task to execute some logic by injecting the necessary ports/adapters. Then we execute the task and return its result. This architecture makes it easy to work on components individually and isolate logic for testing. This leads to very organized code, fast unit tests, and high maintainability—however, this strategy relies on explicit interfaces to keep contracts between components.
Let’s see an example where errors can easily occur:
In the example method, we call Action.perform with either a SynchronousIndexer or an AsynchronousIndexer. Both implement the index method in a different manner. For example, the AsynchronousIndexer may enqueue a job via a job queue, whereas the SynchronousIndexer may store values in a database immediately. The problem is that there’s no way to know if both indexers have the index method or if they return the correct result type expected by Action.perform.
In this situation, Sorbet interfaces are handy:
We define a module called Indexer that serves as our interface. AsynchronousIndexer and SynchronousIndexer as classes which implement this interface, which means that they both implement the index method. The index method must take in an array of keyword strings, and return a Result object as well as a list of errors.
Now we can modify action to take an Indexer as a parameter so that it’s guaranteed that the indexer provided will implement the index method as expected. Now it’s clear to a developer what types are being used and it also ensures that the code behaves as expected.
4. Support for Gradual Refactoring
One roadblock to adding Sorbet to an entire codebase is that it’s a lot of work to refactor every file to be typed. Fortunately, Sorbet supports gradual typing. It statically types your codebase on a file-by-file level, so one can refactor at their own pace. A nice feature is that it comes with 5 different typing strictness levels, so one can choose the level of granularity. These levels also allow for gradual adoption across files in a codebase.
On the ads team, we decided to refactor using a namespace-by-namespace scheme. When a particular Github issue requires committing to a set of files in the same namespace, we upgrade those to the minimum typed level of true, adding method signatures, interfaces, enums, and structs as needed.
Enforcing Type Safety Catches Errors
Typing our methods and data types with Sorbet encourages us to adhere to our design patterns more strictly. Sticking to our patterns keeps our code organized and friendly to developers while also discouraging duplication and bad practices. Enforcing type safety in our code saves us from shipping unsafe code to production and catches errors that our unit tests may not catch.
We encourage everyone to try it in their projects!
We're always on the lookout for talent and we’d love to hear from you. Visit our Engineering career page to find out about our open positions.
A recording for our event, ShipIt! presents Understanding Programs Using Graphs in TruffleRuby, is now available in the ShipIt! Presents section of this page.
You may have heard that a compiler uses a data structure called an abstract-syntax-tree, or AST, when it parses your program, but it’s less common knowledge that an AST is normally used just at the very start of compilation, and a powerful compiler generally uses a more advanced type of data structure as its intermediate representation to optimize your program and translate it to machine code in the later phases of compilation. In the case of TruffleRuby, the just-in-time compiler for Ruby that we’re working on at Shopify, this data structure is something called a sea-of-nodes graph.
I want to show you a little of what this sea-of-nodes graph data structure looks like and how it works, and I think it’s worth doing this for a couple of reasons. First of all, I just think it’s a really interesting and beautiful data structure, but also a practical one. There’s a lot of pressure to learn about data structures and algorithms in order to pass interviews in our industry, and it’s nice to show something really practical that we’re applying here at Shopify. Also, the graphs in sea-of-nodes are just really visually appealing to me and I wanted to share them.
Secondly, knowing just a little about this data structure can give you some pretty deep insights into what your program really means and how the compiler understands it, so I think it can increase your understanding of how your programs run.
I should tell you at this point that I’m afraid I’m actually going to be using Java to show my examples, in order to keep them simpler and easier to understand. This is because compared to Ruby, Java has much simpler semantics—simpler rules for how the language works—and so much simpler graphs. For example, if you index an array in Java that’s pretty much all there is to it, simple indexing. If you index an array in Ruby you could have a positive index, a negative index, a range, conversion, coercion, and lots more—it’s just more complicated. But don’t worry, it’s all super-basic Java code, so you can just pretend it’s pseudo code if you’re coming from Ruby or any other language.
Reading Sea-of-nodes Graphs
Lets dive straight in by showing some code and the corresponding sea-of-nodes graph.
Here’s a Java method. As I said, it’s not using any advanced Java features so you can just pretend it’s pseudo code if you want to. It returns a number from a mathematical sequence known as the Fibonacci sequence, using a simple recursive approach.
Here’s the traditional AST data structure for this program. It’s a tree, and it directly maps to the textual source code, adding and removing nothing. To run it you’d follow a path in the tree, starting at the top and moving through it depth-first.
Abstract syntax tree for the Fibonacci sequence program
And here’s the sea-of-nodes graph for the same program. This is a real dump of the data structure as used in practice to compile the Java method for the Fibonacci sequence we showed earlier.
Sea-of-nodes graph for the Fibonacci sequence program
There’s quite a lot going on here, but I’ll break it down.
We’ve got boxes and arrows, so it’s like a flowchart. The boxes are operations, and the arrows are connections between operations. An operation can only run after all the operations with arrows into it have run.
A really important concept is that there are two main kinds of arrows that are very different. Thick red arrows show how the control flows in your program. Thin green arrows show how the data flows in your program. The dashed black arrows are meta-information. Some people draw the green arrows pointing upwards, but in our team we think it’s simpler to show data flowing downwards.
There are also two major kinds of boxes for operations. Square red boxes do something; they have a side-effect or are imperative in some way. Diamond green boxes compute something (they’re pure, or side-effect free), and green for safe to execute whenever.
P(0) means parameter 0, or the first parameter. C(2) means a constant value of 2. Most of the other nodes should be understandable from their labels. Each node has a number for easy reference.
To run the program in your head, start at the Start node at the top and move down thick red arrows towards one of the Return nodes at the bottom. If your square red box has an arrow into it from an oval or diamond green box, then you run that green box, and any other green boxes pointing into that green box, first.
Here’s one major thing that I think is really great about this data structure. The red parts are an imperative program, and the green parts are mini functional programs. We’ve separated the two out of the single Java program. They’re joined where it matters, and not where it doesn’t. This will get useful later on.
Understanding Through Graphs
I said that I think you can learn some insights about your program using these graphs. Here’s what I mean by that.
When you write a program in text, you’re writing in a linear format that implies lots of things that aren’t really there. When we get the program into a graph format, we can encode only the actual precise rules of the language and relax everything else.
I know that’s a bit abstract, so here’s a concrete example.
Based on a three-way if-statement it does some arithmetic. Notice that b * c is common to two of the three branches.
Sea-of-nodes graph for a three-way if-statement-program
When we look at the graph for this we can see a really clear division between the imperative parts of the program and the functional parts. Notice in particular that there is only one multiplication operation. The value of a * b is the same on whichever branch you compute it, so we have just one value node in the graph to compute it. It doesn’t matter that it appeared twice in the textual source code—it has been de-duplicated by a process known as global value numbering. Also, the multiplication node isn’t fixed in either of the branches, because it’s a functional operation and it could happen at any point and it makes no change to what the program achieves.
When you look at the source code you think that you pick a branch and only then you may execute a * b, but looking at the graph we can see that the computation a * b is really free from which branch you pick. You can run it before the branch if you want to, and then just ignore it if you take the branch which doesn’t need it. Maybe doing that produces smaller machine code because you only have the code for the multiplication once, and maybe it’s faster to do the multiplication before the branch because your processor can then be busy doing the multiplication while it decides which branch to go to.
As long as the multiplication node’s result is ready when we need it, we’re free to put it wherever we want it.
You may look at the original code and say that you could refactor it to have the common expression pulled out in a local variable. We can see here that doing that makes no difference to how the compiler understands the code. It may still be worth it for readability, but the compiler sees through your variable names and moves the expression to where it thinks it makes sense. We would say that it floats the expression.
Graphs With Loops
Here’s another example. This one has a loop.
It adds the parameter a to an accumulator n times.
Sea-of-nodes graph for a program with loops
This graph has something new, an extra thick red arrow backward now. That closes the loop, it’s the jump back to the start of the loop for a new iteration.
The program is written in an imperative way, with a traditional iterative looping construct as you’d use in C, but if we look at the little isolated functional part, we can see the repeated addition on its own very clearly. There’s literally a little loop showing that the + 1 operation runs repeatedly on its own result.
Isolated functional part of sea-of-nodes graph
That phi node (the little circle with the line in it is a Greek letter) is a slightly complicated concept with a traditional name. It means that the value at that point may be one of multiple possibilities.
Should We Program Using Graphs?
Every few years someone writes a new PhD thesis on how we should all be programming graphically instead of using text. I think you can possibly see the potential benefits and the practical drawbacks of doing that by looking at these graphs.
One benefit is that you’re free to reshape, restructure, and optimize your program by manipulating the graph. As long as you maintain a set of rules, the rules for the language you’re compiling, you can do whatever you want.
A drawback is that it’s not exactly compact. This is a 6 line method but it’s a full-screen to draw it as a graph, and it already has 21 nodes and 22 arrows in it. As we get bigger graphs it becomes impossible to draw them without the arrows starting to cross and they become so long that they have no context—you can’t see where they’re going to or coming from, and then it becomes much harder to understand.
Using Sea-of-nodes Graphs at Shopify
At Shopify we’re working on ways to understand these graphs at Shopify-scale. The graphs for idiomatic Ruby code in a codebase like our Storefront Renderer can get very large and very complicated—for example this is the Ruby equivalent to the Java Fibonacci example.
One tool we’re building is the program to draw these graphs that I’ve been showing you. It takes compiler debug dumps and produces these illustrations. We’re also working on a tool to decompile the graphs back to Ruby code, so that we can understand how Ruby code is optimized, by printing the optimized Ruby code. That means that developers who just know Ruby can use Ruby to understand what the compiler is doing.
Summary
In summary, this sea-of-nodes graph data structure allows us to represent a program in a way that relaxes what doesn’t matter and encodes the underlying connections between parts of the program. The compiler uses it to optimize your program. You may think of your program as a linear sequence of instructions, but really your compiler is able to see through that to something simpler and more pure, and in TruffleRuby it does that using sea-of-nodes.
Sea-of-nodes graphs are an interesting and, for most people, novel way to look at your program.
ShipIt! Presents: Understanding Programs Using Graphs in TruffleRuby
Watch Chris Seaton and learn about TruffleRuby’s sea-of-nodes. This beautiful data structure can reveal surprising in-depth insights into your program.


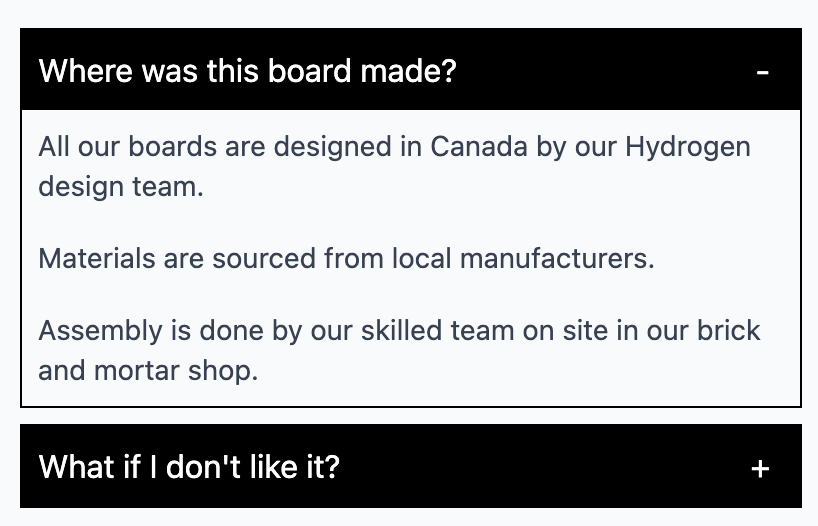


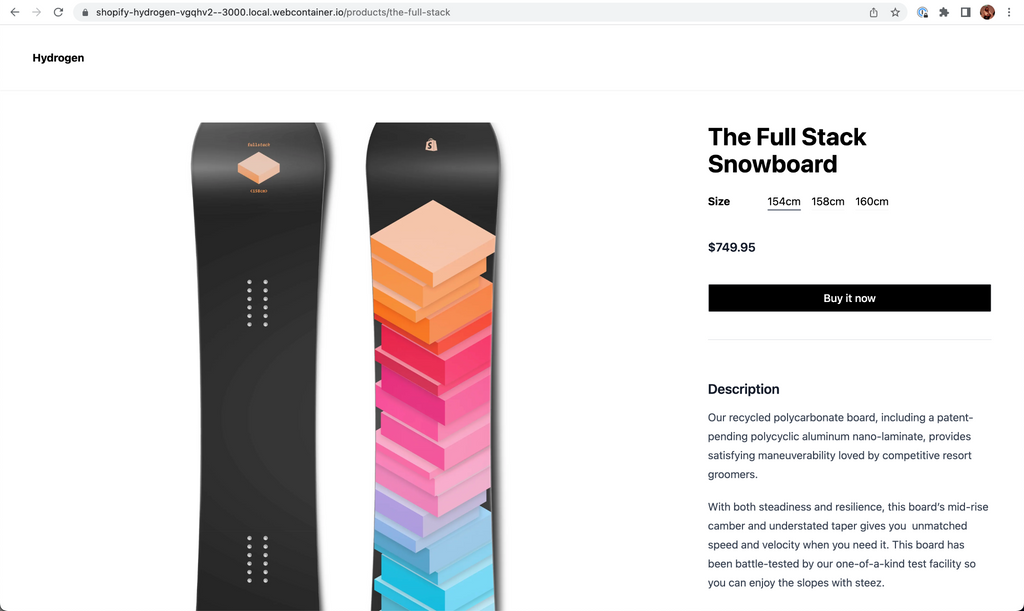


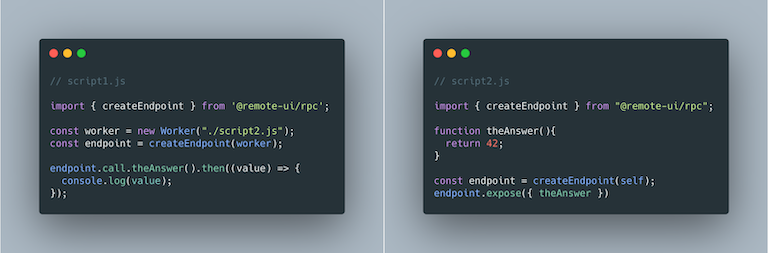
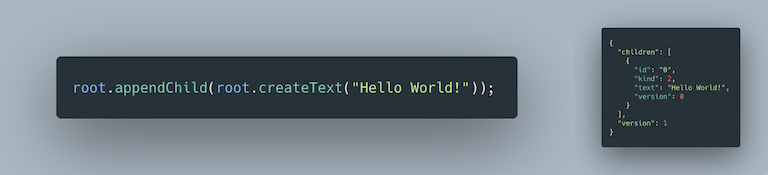


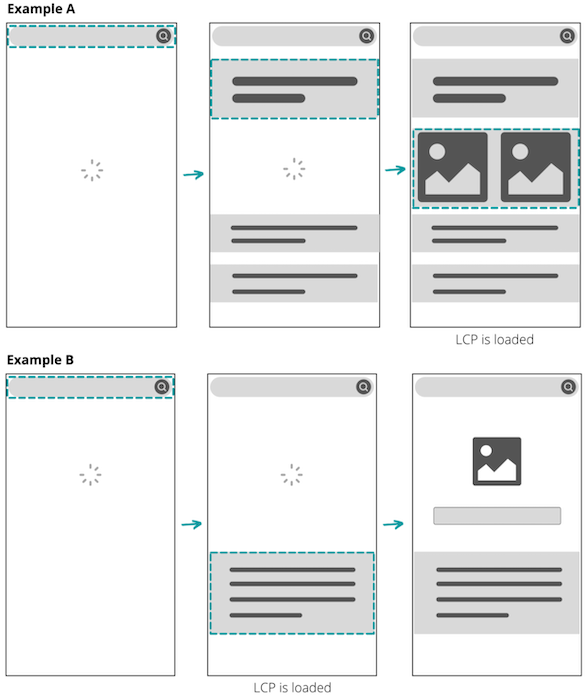

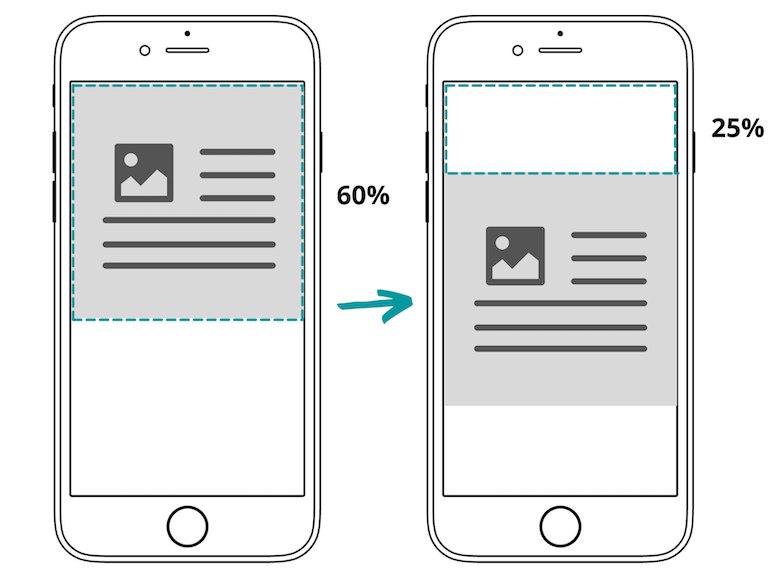


![A screenshot of the Query screen with a result displaying the field allFood: [Food!]!](https://cdn.shopify.com/s/files/1/0779/4361/files/GraphiQLDocsQuery.png?v=1625240813)